
 Nasdaq
 華爾街日報
華爾街日報Has Shopify’s 2025 Rally Outrun Fundamentals After Refocusing On Core Ecommerce Business?
- If you are wondering whether Shopify is still attractive at current levels or if the easy money has already been made, this breakdown is for you.
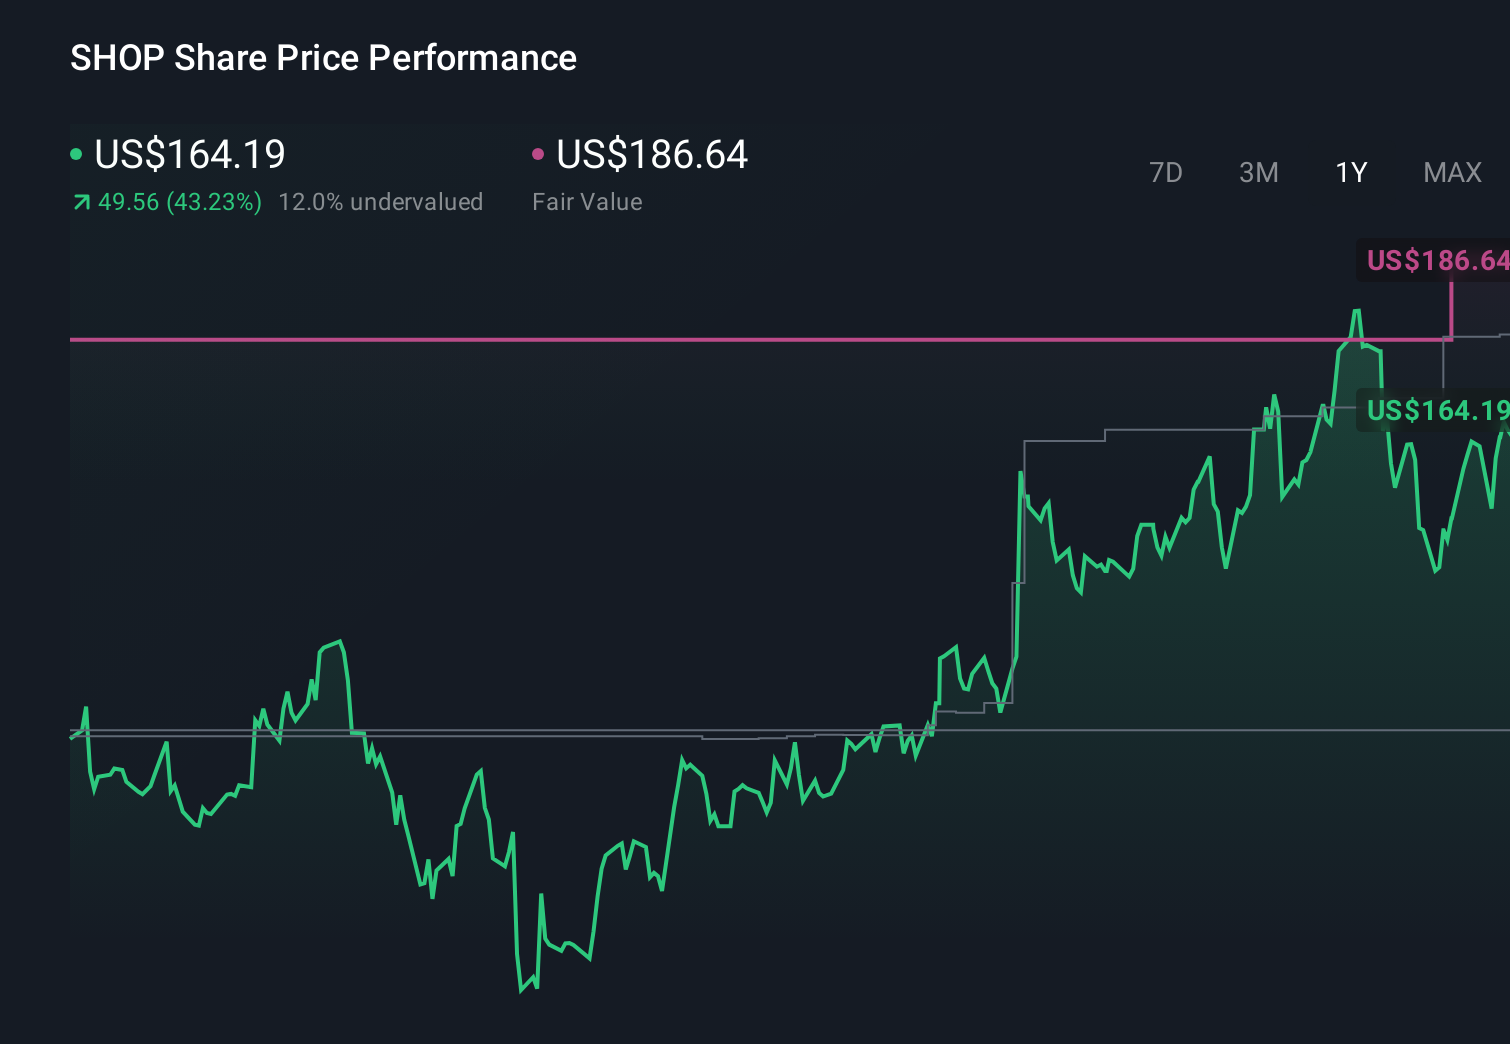
- Shopify's share price has climbed 4.8% over the last week, 9.1% over the past month, and is up 57.6% year to date, adding to a 53.8% gain over the last year and a 419.1% return over three years.
- Recent headlines have focused on Shopify doubling down on its core e commerce infrastructure, trimming non core bets, and striking new partnerships with social and logistics platforms. These moves have influenced how investors see its long term growth runway and risk profile.
- Despite that momentum, Shopify currently scores just 0/6 on our standard undervaluation checks. We will walk through what different valuation methods indicate about the stock today and then look at a more nuanced way to think about its value.
Shopify scores just 0/6 on our valuation checks. See what other red flags we found in the full valuation breakdown.
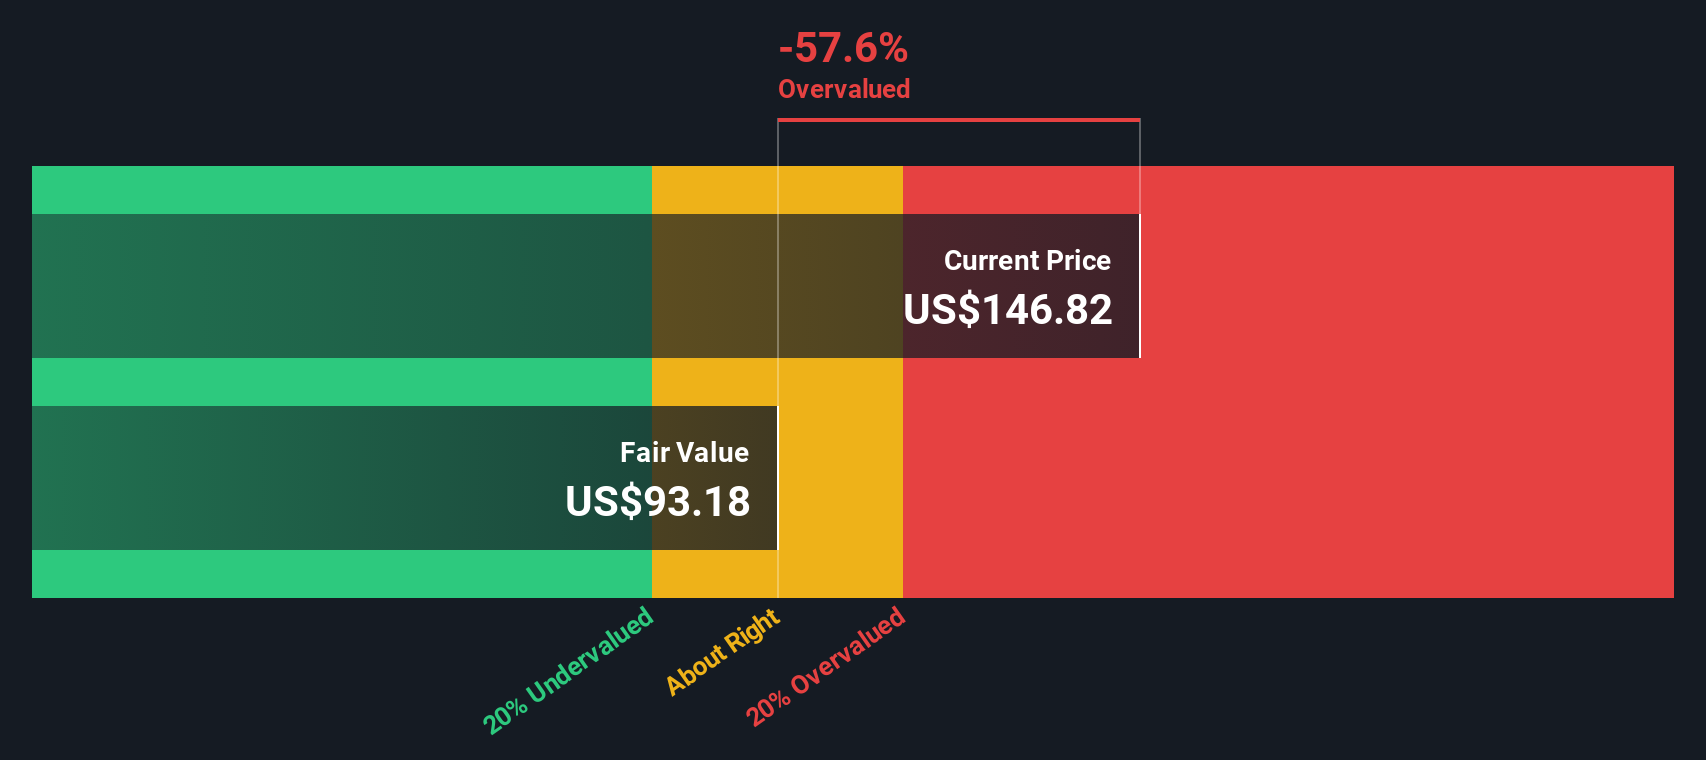
Approach 1: Shopify Discounted Cash Flow (DCF) Analysis
A Discounted Cash Flow, or DCF, model estimates what a business is worth today by projecting the cash it can generate in the future and discounting those cash flows back to their value in the present.
For Shopify, the model starts with last twelve months Free Cash Flow of about $1.89 billion. Analysts supply detailed forecasts for the next few years, and beyond that Simply Wall St extrapolates growth, building a 2 stage Free Cash Flow to Equity profile. Under this framework, Shopify's annual Free Cash Flow is projected to rise to roughly $9.95 billion by 2035 as the business scales.
When those future cash flows are discounted back into today’s dollars, the model arrives at an estimated intrinsic value of about $97.68 per share. Compared with the current market price, this implies the stock is roughly 73.5% above the level the DCF would justify. This suggests investors are already pricing in very optimistic growth and margin outcomes.
Result: OVERVALUED
Our Discounted Cash Flow (DCF) analysis suggests Shopify may be overvalued by 73.5%. Discover 905 undervalued stocks or create your own screener to find better value opportunities.
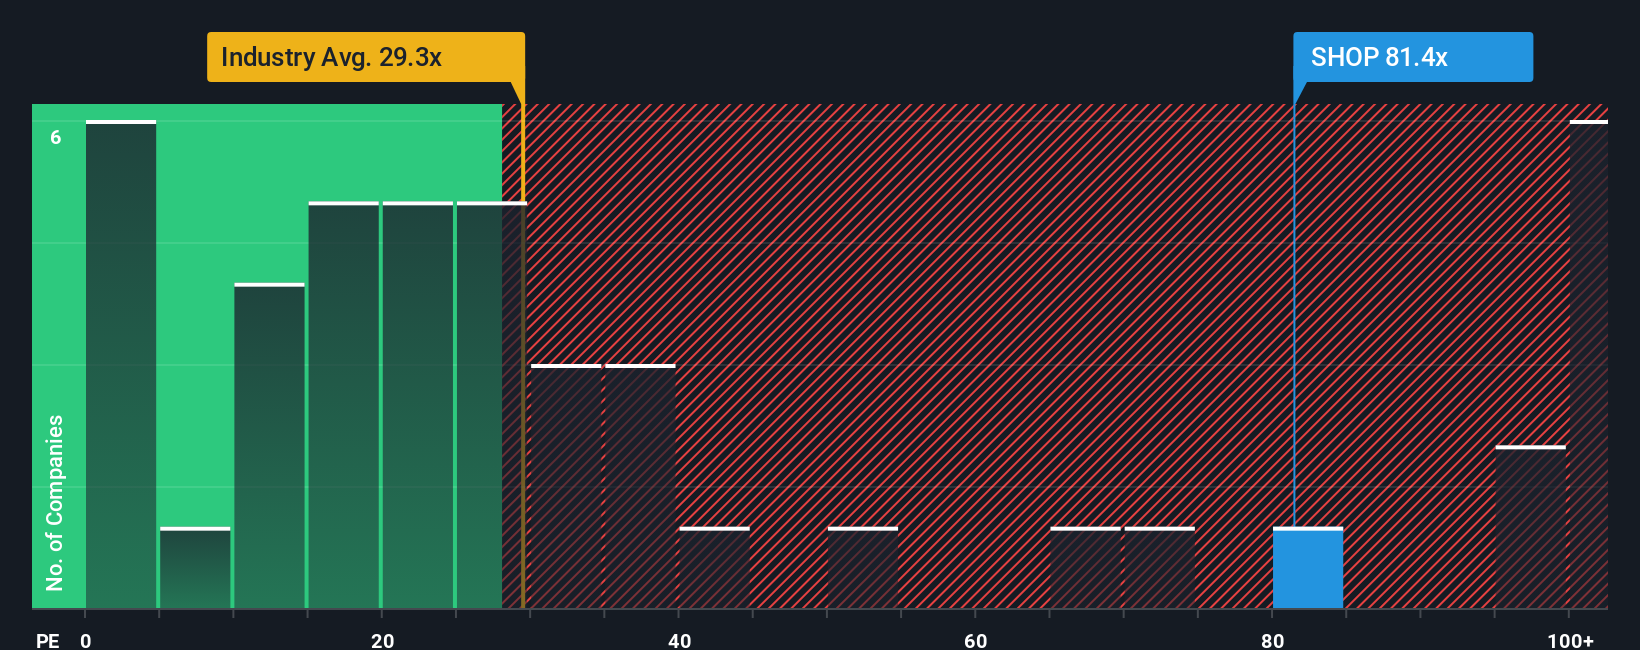
Approach 2: Shopify Price vs Earnings
For a consistently profitable company like Shopify, the price to earnings, or PE, ratio is a useful yardstick because it ties the valuation directly to the profits that ultimately support shareholder returns. The higher the expected growth and the lower the perceived risk, the more investors are typically willing to pay in terms of a higher PE multiple.
Shopify currently trades on a PE of about 123.9x, which is extremely rich compared to the broader IT industry average of roughly 29.4x and even well above its peer group average of about 38.6x. On those simple comparisons alone, the stock looks very expensive. However, these benchmarks do not fully reflect Shopify specific traits such as its growth runway, profitability profile, scale, and risk factors.
This is where Simply Wall St’s Fair Ratio comes in. It is a proprietary estimate of what a reasonable PE should be for Shopify, given its earnings growth, margins, industry, market cap, and risk. For Shopify, the Fair Ratio is calculated at about 49.9x, which is far below the current 123.9x. Because this tailored benchmark adjusts for the company’s strengths and risks, it offers a more nuanced view than raw peer or industry comparisons, and still indicates the shares are priced far above what fundamentals justify.
Result: OVERVALUED
PE ratios tell one story, but what if the real opportunity lies elsewhere? Discover 1459 companies where insiders are betting big on explosive growth.
Upgrade Your Decision Making: Choose your Shopify Narrative
Earlier we mentioned that there is an even better way to understand valuation, so let us introduce you to Narratives, a simple way to connect your view of Shopify’s story with the numbers behind its future revenue, earnings and margins, and then translate that into a Fair Value you can compare against today’s share price. A Narrative on Simply Wall St is your own structured story for a company, hosted on the Community page used by millions of investors, where you set assumptions about growth, profitability and risk that automatically generate a forecast and Fair Value estimate. This makes it easier to decide when to buy or sell, because you can quickly see whether your Fair Value is above or below the current Price and by how much, and your Narrative will keep updating as new news, earnings or guidance comes in. For Shopify, one investor might build a bullish Narrative that leans into rapid AI driven product adoption and international expansion to justify a Fair Value closer to 200 dollars per share, while another might focus on competition, margin pressure and macro risks to support something nearer 114 dollars, and both can transparently see how their story flows through to the numbers.
Do you think there's more to the story for Shopify? Head over to our Community to see what others are saying!
This article by Simply Wall St is general in nature. We provide commentary based on historical data and analyst forecasts only using an unbiased methodology and our articles are not intended to be financial advice. It does not constitute a recommendation to buy or sell any stock, and does not take account of your objectives, or your financial situation. We aim to bring you long-term focused analysis driven by fundamental data. Note that our analysis may not factor in the latest price-sensitive company announcements or qualitative material. Simply Wall St has no position in any stocks mentioned.
Have feedback on this article? Concerned about the content? Get in touch with us directly. Alternatively, email editorial-team@simplywallst.com