
 Nasdaq
 華爾街日報
華爾街日報Is It Too Late to Consider Robinhood After Its Stunning 205% Rally in 2025?
- If you are wondering whether Robinhood Markets has already had its big run or if there is still value on the table, you are not alone. That is exactly what we are going to unpack here.
- With the stock up 3.8% over the last week, 4.6% over the past month, and an eye catching 204.9% year to date, the market is clearly rethinking what Robinhood is worth.
- Part of that momentum has been fueled by steady product expansion, as Robinhood has pushed further into retirement accounts, credit products, and more advanced trading tools for active users. The company has also stayed in the headlines as a key gateway for new retail investors, keeping sentiment around its long term growth story very much alive.
- Even so, Robinhood only scores 1 out of 6 on our valuation checks, suggesting that on most traditional metrics the stock does not look like a bargain, at least not yet. Next we will break down what different valuation approaches are saying about Robinhood today, before finishing with another way to make sense of its worth over the long run.
Robinhood Markets scores just 1/6 on our valuation checks. See what other red flags we found in the full valuation breakdown.
Approach 1: Robinhood Markets Excess Returns Analysis
The Excess Returns model looks at how much profit a company can generate above the required return that shareholders demand, then adds the value of those excess profits to its underlying book value. It is essentially asking how effectively Robinhood can reinvest shareholder capital at attractive rates over time.
For Robinhood, the model starts with a Book Value of $9.53 per share and a Stable EPS of $2.63 per share, based on weighted future Return on Equity estimates from 8 analysts. With an Average Return on Equity of 21.22% and a Cost of Equity of $1.05 per share, the company is expected to generate an Excess Return of $1.59 per share. Analysts also see Stable Book Value rising to $12.41 per share, supported by forecasts from 5 analysts.
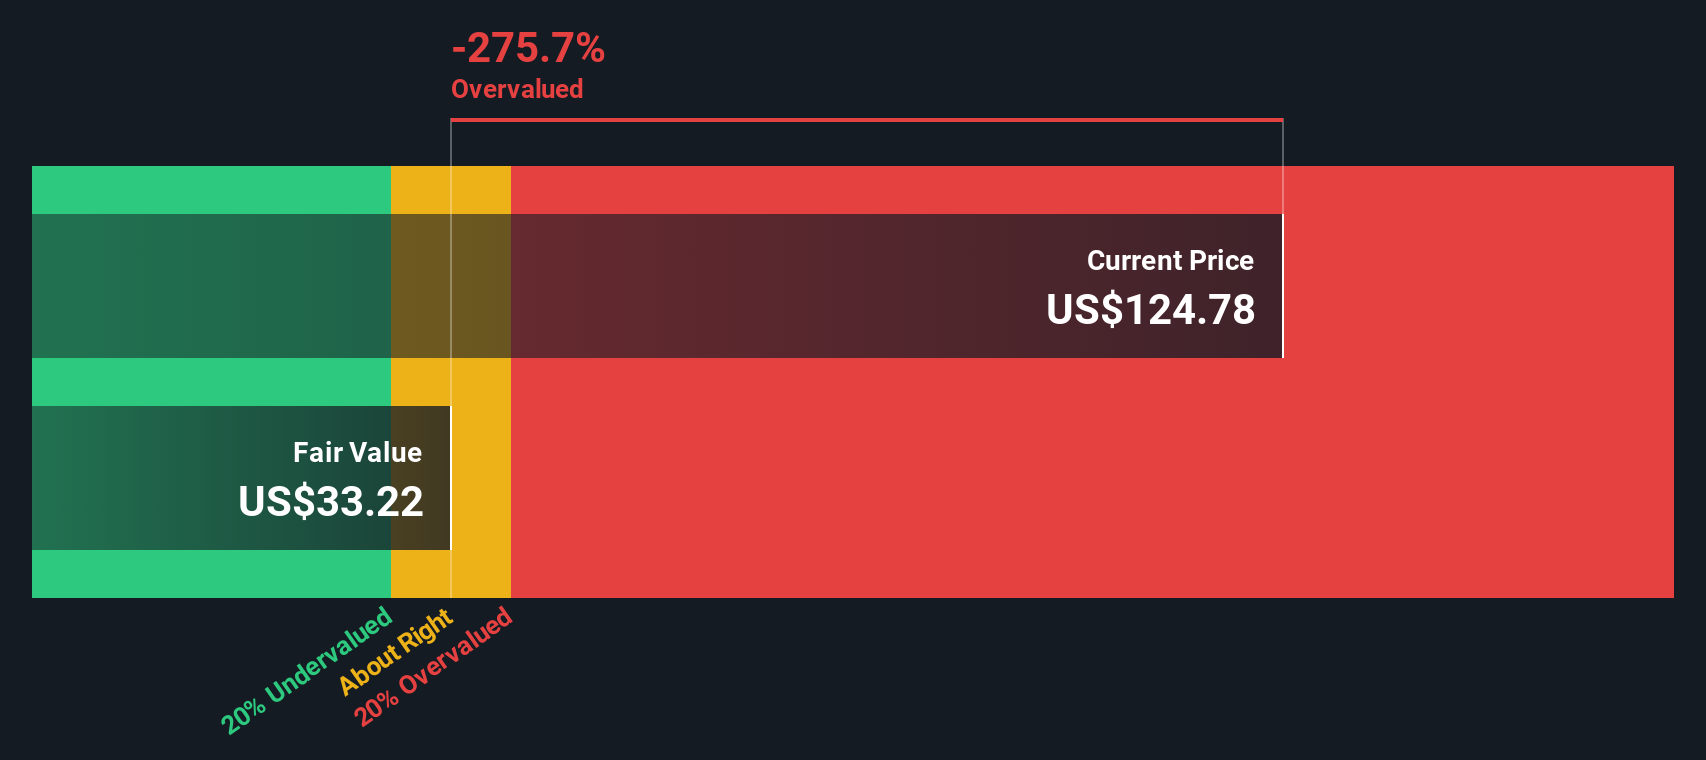
These inputs combine to an Excess Returns fair value of about $43 per share. Compared with the current market price, this implies the stock is roughly 179.9% overvalued, which indicates the market is paying a steep premium for future growth.
Result: OVERVALUED
Our Excess Returns analysis suggests Robinhood Markets may be overvalued by 179.9%. Discover 908 undervalued stocks or create your own screener to find better value opportunities.
Approach 2: Robinhood Markets Price vs Earnings
For a profitable business like Robinhood, the price to earnings (PE) ratio is a useful yardstick because it directly links what investors are paying to the profits the company is already generating. In general, faster growing and less risky companies tend to justify a higher “normal” or “fair” PE, while slower growth or higher uncertainty should pull that multiple down.
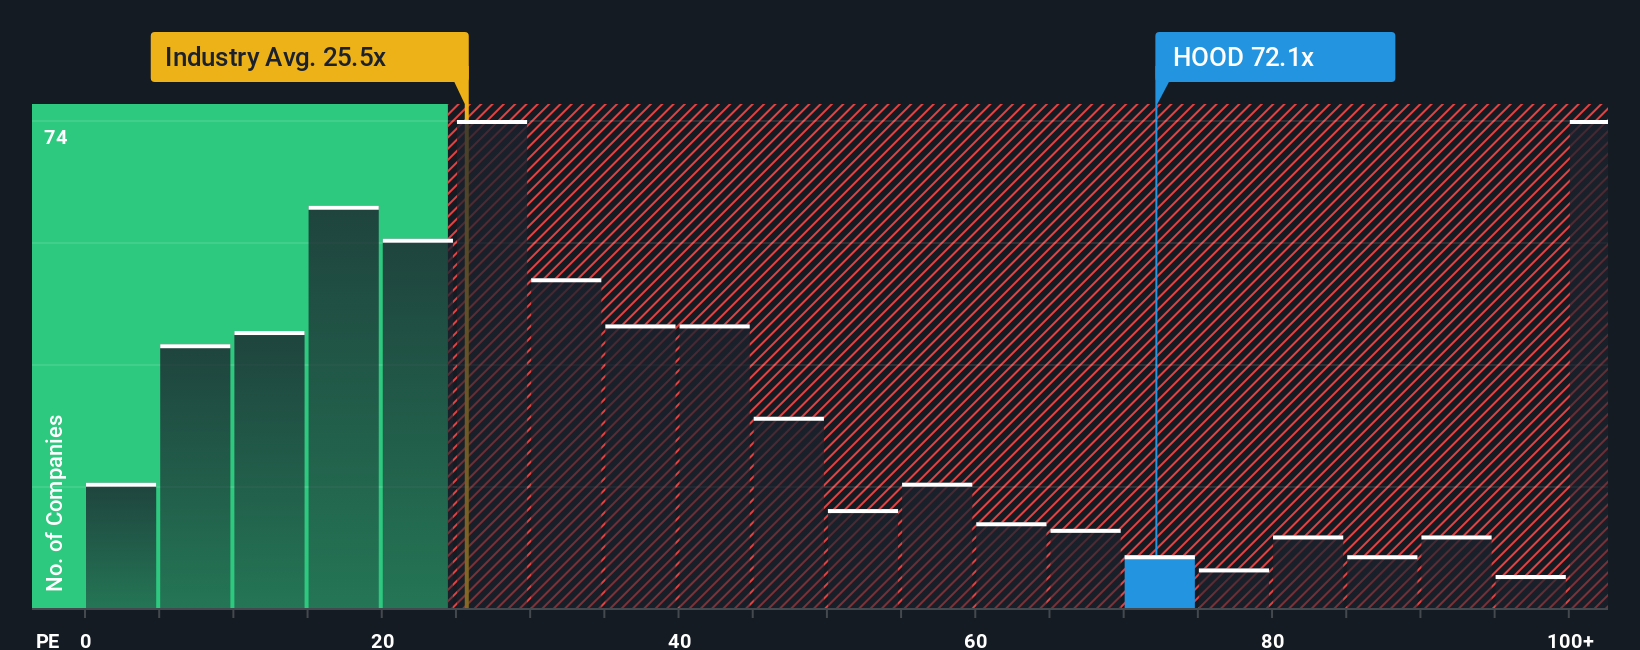
Robinhood currently trades on a PE of about 49.28x, which is well above both the Capital Markets industry average of 25.71x and the average of key peers at 22.86x. On the surface, that suggests investors are paying a substantial premium for Robinhood’s growth story compared to the broader sector.
Simply Wall St’s Fair Ratio framework goes a step further by estimating what PE Robinhood should trade on after accounting for its earnings growth outlook, industry, profit margins, size, and risk profile. For Robinhood, this Fair Ratio is 27.62x, implying a more moderate premium than the market is currently assigning. Because this tailored benchmark reflects company specific strengths and risks, it is more informative than a simple comparison with peers or industry averages. With the actual PE of 49.28x sitting well above the Fair Ratio, the stock screens as materially overvalued on this basis.
Result: OVERVALUED
PE ratios tell one story, but what if the real opportunity lies elsewhere? Discover 1457 companies where insiders are betting big on explosive growth.
Upgrade Your Decision Making: Choose your Robinhood Markets Narrative
Earlier we mentioned that there is an even better way to understand valuation, so let us introduce you to Narratives, where you attach a clear story about Robinhood’s future to specific numbers for revenue, earnings, margins and fair value, then track how that story stacks up against today’s share price.
A Narrative links what you believe about the business, such as prediction markets and the MIAXdx venture driving durable growth, directly into a financial forecast and then into a Fair Value, so you can quickly see whether your view suggests Robinhood is worth more or less than the current market price.
On Simply Wall St’s Community page, used by millions of investors, Narratives are an easy, accessible tool that automatically update as new information like earnings, regulatory news, or product launches arrives, helping you decide when to buy, hold, or sell by comparing your Narrative Fair Value with Robinhood’s latest price.
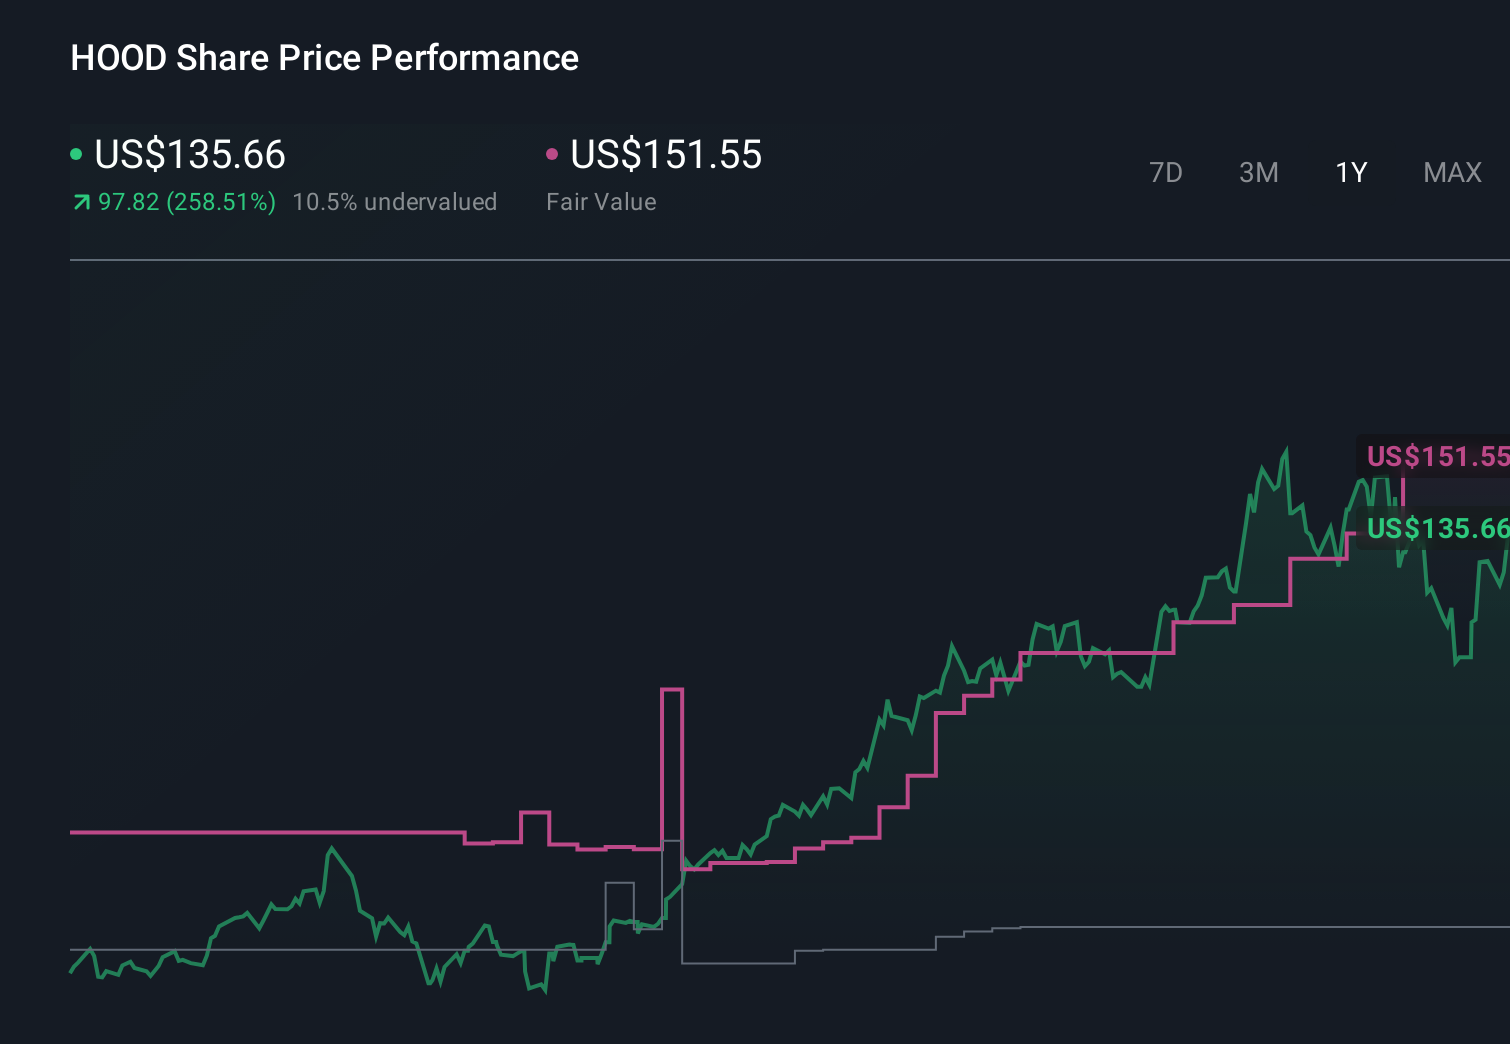
For example, one bullish Robinhood Narrative currently points to a Fair Value around $151.55 per share, while a more cautious view anchors closer to the low analyst target of $50, showing how different perspectives on growth, margins, and risk can lead to very different conclusions about whether HOOD still offers upside or is priced for perfection.
Do you think there's more to the story for Robinhood Markets? Head over to our Community to see what others are saying!
This article by Simply Wall St is general in nature. We provide commentary based on historical data and analyst forecasts only using an unbiased methodology and our articles are not intended to be financial advice. It does not constitute a recommendation to buy or sell any stock, and does not take account of your objectives, or your financial situation. We aim to bring you long-term focused analysis driven by fundamental data. Note that our analysis may not factor in the latest price-sensitive company announcements or qualitative material. Simply Wall St has no position in any stocks mentioned.
Have feedback on this article? Concerned about the content? Get in touch with us directly. Alternatively, email editorial-team@simplywallst.com