
 Nasdaq
 華爾街日報
華爾街日報Is Accenture Now an Opportunity After a 22% Slide and DCF Upside in 2025?
- Wondering if Accenture’s recent slump has finally turned it into a value opportunity, or if the market is telling you to stay cautious?
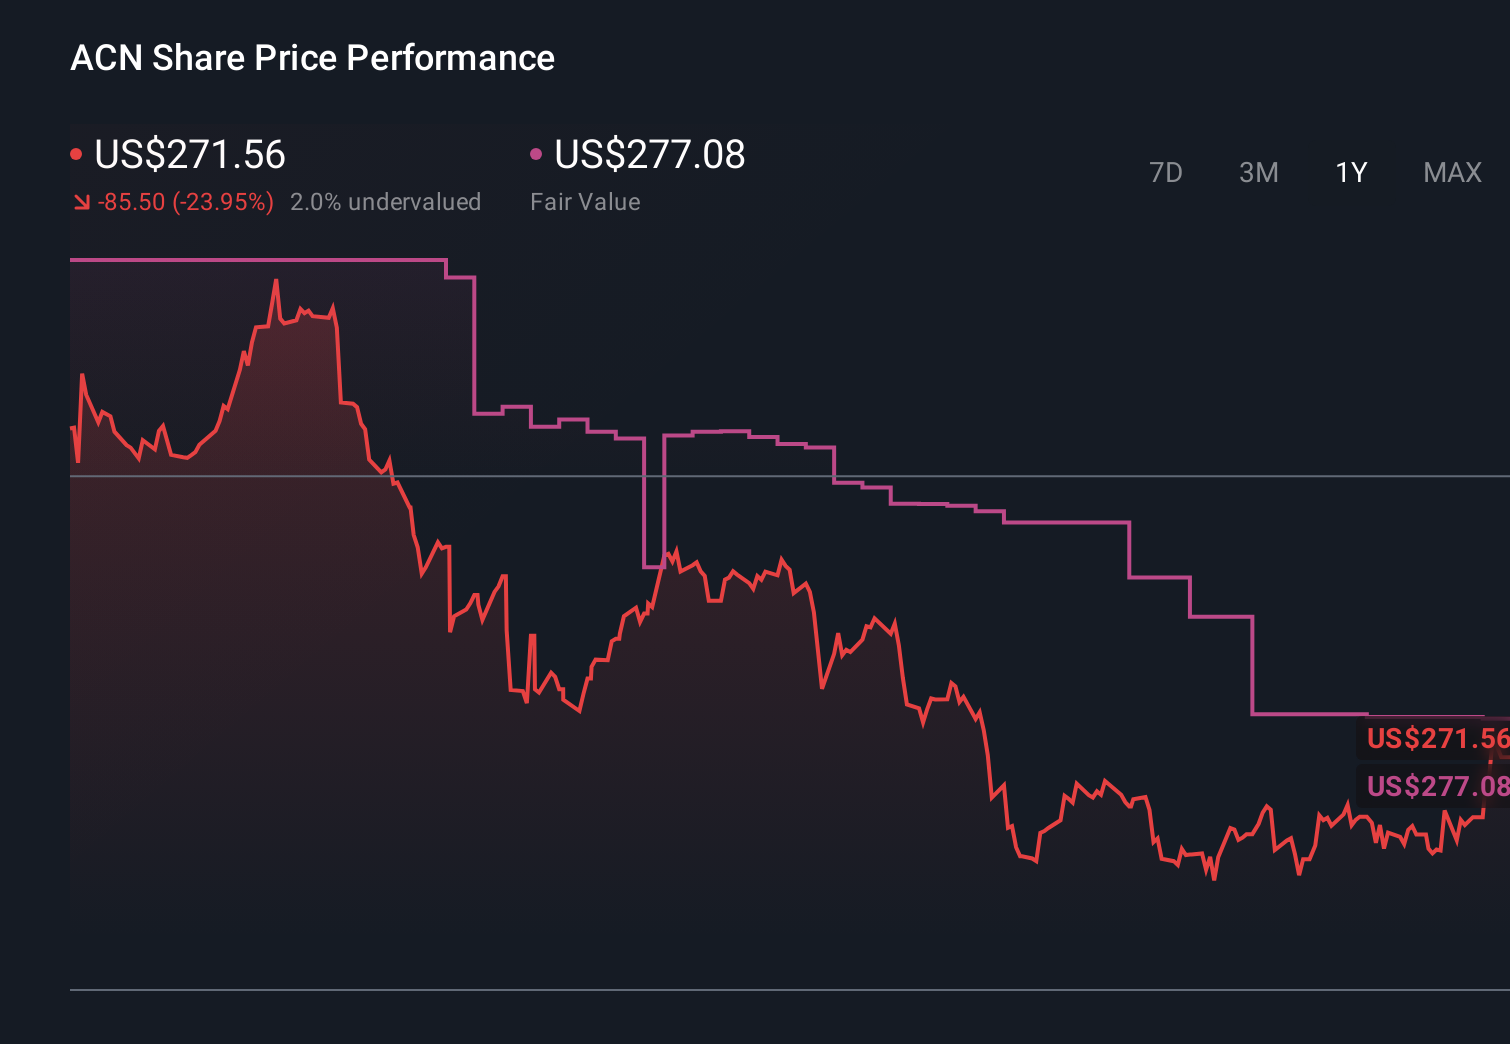
- After falling roughly 22.4% year to date and 23.6% over the last year, the stock has started to stabilize, with a 7.5% gain over the past month despite a small dip of 0.5% in the last week.
- Investors have been reacting to ongoing headlines around tech spending, digital transformation budgets, and consulting demand, all of which feed directly into Accenture’s growth story. At the same time, management’s continued focus on cloud, data, and AI services has kept the long term narrative alive even as short term sentiment has wobbled.
- On our checks, Accenture scores a 5/6 valuation score, suggesting it screens as undervalued on most metrics. Next, we will break down what that means across different valuation approaches, before finishing with a framework that can help you think about value even more effectively.
Find out why Accenture's -23.6% return over the last year is lagging behind its peers.
Approach 1: Accenture Discounted Cash Flow (DCF) Analysis
A Discounted Cash Flow model estimates what a company is worth by projecting its future cash flows and then discounting them back to today’s value. For Accenture, this starts with its last twelve months of Free Cash Flow of about $11.5 billion, which forms the base for future expectations.
Analysts and extrapolated estimates suggest Accenture’s Free Cash Flow could rise to roughly $15.1 billion by 2030, with a two stage Free Cash Flow to Equity model used to bridge the years in between. Simply Wall St discounts each of these projected cash flows back to today, in dollar terms, to account for risk and the time value of money, then sums them to arrive at an intrinsic value per share.
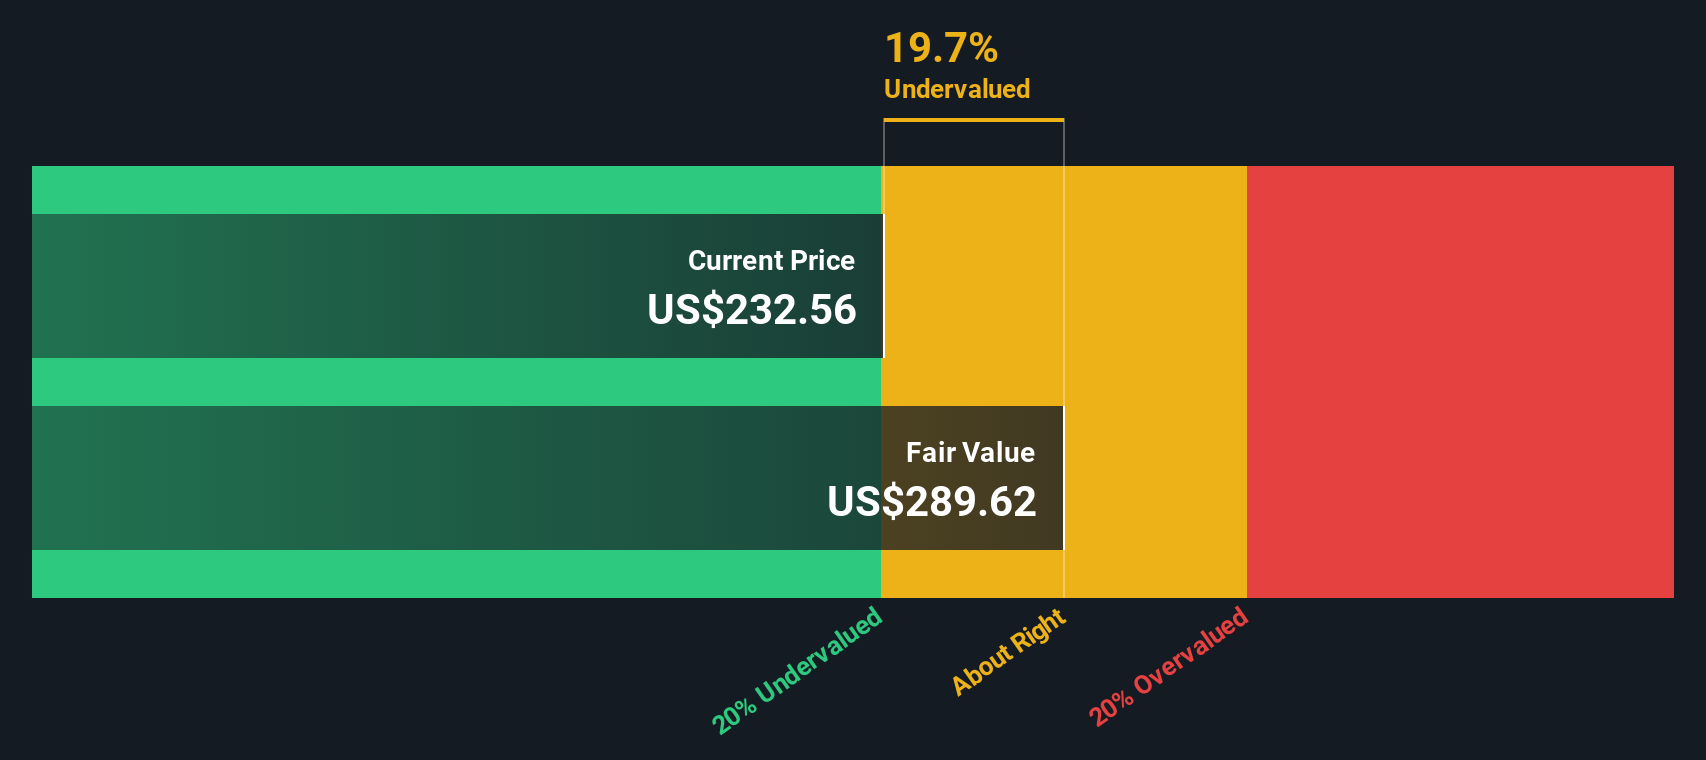
On this basis, the DCF model estimates Accenture’s fair value at about $351.18 per share. Compared with the current market price, this implies the stock is trading at roughly a 22.9% discount, suggesting investors are paying materially less than the model’s assessment of intrinsic value.
Result: UNDERVALUED
Our Discounted Cash Flow (DCF) analysis suggests Accenture is undervalued by 22.9%. Track this in your watchlist or portfolio, or discover 908 more undervalued stocks based on cash flows.
Approach 2: Accenture Price vs Earnings
For profitable, established businesses like Accenture, the Price to Earnings (PE) ratio is a useful way to gauge how much investors are willing to pay for each dollar of current earnings. It naturally incorporates the market’s view on growth and risk, since companies with faster, more reliable earnings growth usually command higher PE multiples, while those facing uncertainty tend to trade on lower ones.
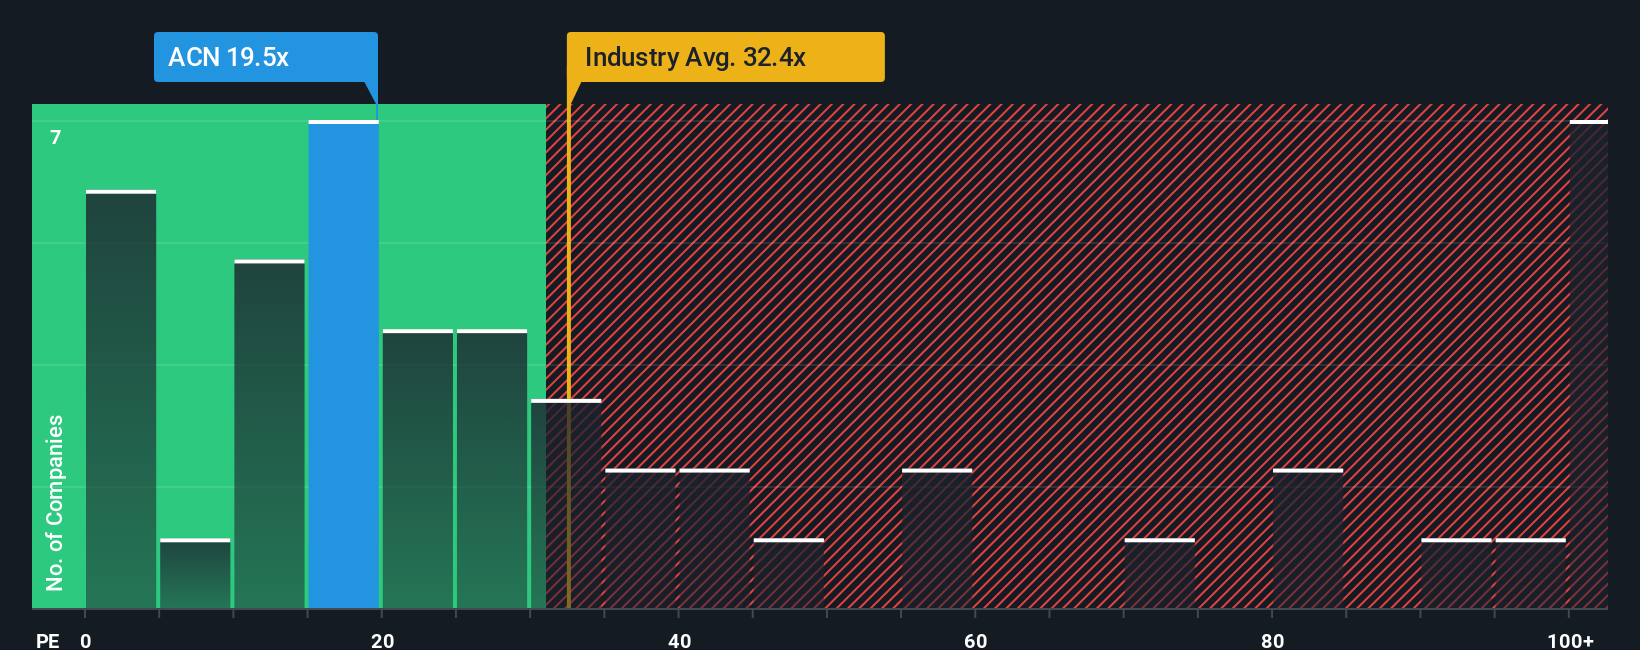
Accenture currently trades on a PE of about 21.9x, which is below both the broader IT industry average of roughly 29.5x and the peer group average of around 25.7x. Simply Wall St’s proprietary Fair Ratio framework goes a step further by estimating what PE multiple would be reasonable for Accenture, given its earnings growth profile, industry, profit margins, size and risk factors. On this basis, Accenture’s Fair Ratio is estimated at about 36.7x, which is well above where the shares trade today and suggests the market is valuing its earnings more cautiously than this model implies.
Result: UNDERVALUED
PE ratios tell one story, but what if the real opportunity lies elsewhere? Discover 1457 companies where insiders are betting big on explosive growth.
Upgrade Your Decision Making: Choose your Accenture Narrative
Earlier we mentioned that there is an even better way to understand valuation, so let us introduce you to Narratives, a simple framework that lets you attach a clear story to your numbers by stating what you think Accenture’s fair value is and how you expect its revenue, earnings and margins to evolve over time.
A Narrative links three pieces together: the business story you believe, the financial forecast that flows from that story, and the fair value that those forecasts imply. This gives you a transparent bridge from qualitative views to quantitative outcomes.
On Simply Wall St, Narratives are available on the Community page and are used by millions of investors as an easy, accessible way to support decisions about buying or selling. Investors do this by continuously comparing their Fair Value to the live market Price and automatically updating when new information, such as earnings or major news, is released.
For Accenture, one investor might see fair value near $202 and focus on slower growth and margin pressure, while another might justify a value closer to $281 on the view that Gen AI driven demand and resilient profitability deserve a higher multiple over time.
For Accenture however we'll make it really easy for you with previews of two leading Accenture Narratives:
Fair value: $280.58 per share
Implied undervaluation vs last close: -3.5%
Revenue growth assumption: 5.69%
- Views Accenture’s Gen AI, cloud, security and Industry X investments as positioning the company for durable mid single digit revenue growth and modest margin expansion.
- Assumes earnings can grow from about $7.9 billion today to roughly $10.0 billion by 2028, with EPS supported by buybacks and an eventual rerating to a PE multiple in the low to mid 20s.
- Highlights risks from slower federal spending, FX headwinds, margin pressure and intense competition, but still concludes that consensus forecasts justify a fair value modestly above today’s price.
Fair value: $202.38 per share
Implied overvaluation vs last close: 33.8%
Revenue growth assumption: 5.44%
- Argues that after the sector de rating, Accenture now trades near historical average multiples, so the current valuation already reflects its quality and scale.
- Recognizes solid margins, free cash flow, dividends and buybacks, but stresses that bookings have declined, decision cycles are elongated and Gen AI demand has yet to fully translate into sustained revenue acceleration.
- Sees the stock as fundamentally sound but only moderately attractive over 12 to 18 months, with upside dependent on a clear rebound in bookings and organic growth that is not yet visible in the numbers.
Do you think there's more to the story for Accenture? Head over to our Community to see what others are saying!
This article by Simply Wall St is general in nature. We provide commentary based on historical data and analyst forecasts only using an unbiased methodology and our articles are not intended to be financial advice. It does not constitute a recommendation to buy or sell any stock, and does not take account of your objectives, or your financial situation. We aim to bring you long-term focused analysis driven by fundamental data. Note that our analysis may not factor in the latest price-sensitive company announcements or qualitative material. Simply Wall St has no position in any stocks mentioned.
Have feedback on this article? Concerned about the content? Get in touch with us directly. Alternatively, email editorial-team@simplywallst.com