
 Nasdaq
 華爾街日報
華爾街日報Is It Too Late to Consider SK hynix After Its 250% AI Fueled Surge?
- If you are wondering whether SK hynix is still a smart buy after its massive run, or if most of the upside is already priced in, you are not alone. That is exactly what we are going to unpack here.
- The stock has surged about 10.2% over the last week, 12.1% in the past month, and an eye catching 241.1% year to date, with a staggering 250.2% return over the last year that has completely changed how the market views its potential.
- Much of this momentum has been fueled by enthusiasm around SK hynix as a key memory supplier for AI and high bandwidth DRAM, as investors focus on a potential structural demand shift rather than a short lived cycle. At the same time, ongoing headlines about government support for chip capacity and global data center build outs have reinforced the narrative that SK hynix sits at the heart of a multiyear infrastructure upgrade.
- Even after that rally, SK hynix scores a strong 5/6 valuation check, suggesting it still appears undervalued on most of our metrics. Next we will walk through the different valuation approaches we use, before closing with a more holistic way to think about what the stock is really worth.
Approach 1: SK hynix Discounted Cash Flow (DCF) Analysis
A Discounted Cash Flow, or DCF, model estimates what a business is worth today by projecting its future cash flows and then discounting those back into today’s ₩ terms. For SK hynix, the model starts with last twelve month Free Cash Flow of about ₩20.9 trillion and uses analyst forecasts for the next few years. It then extends those out to 2035 using Simply Wall St’s assumptions.
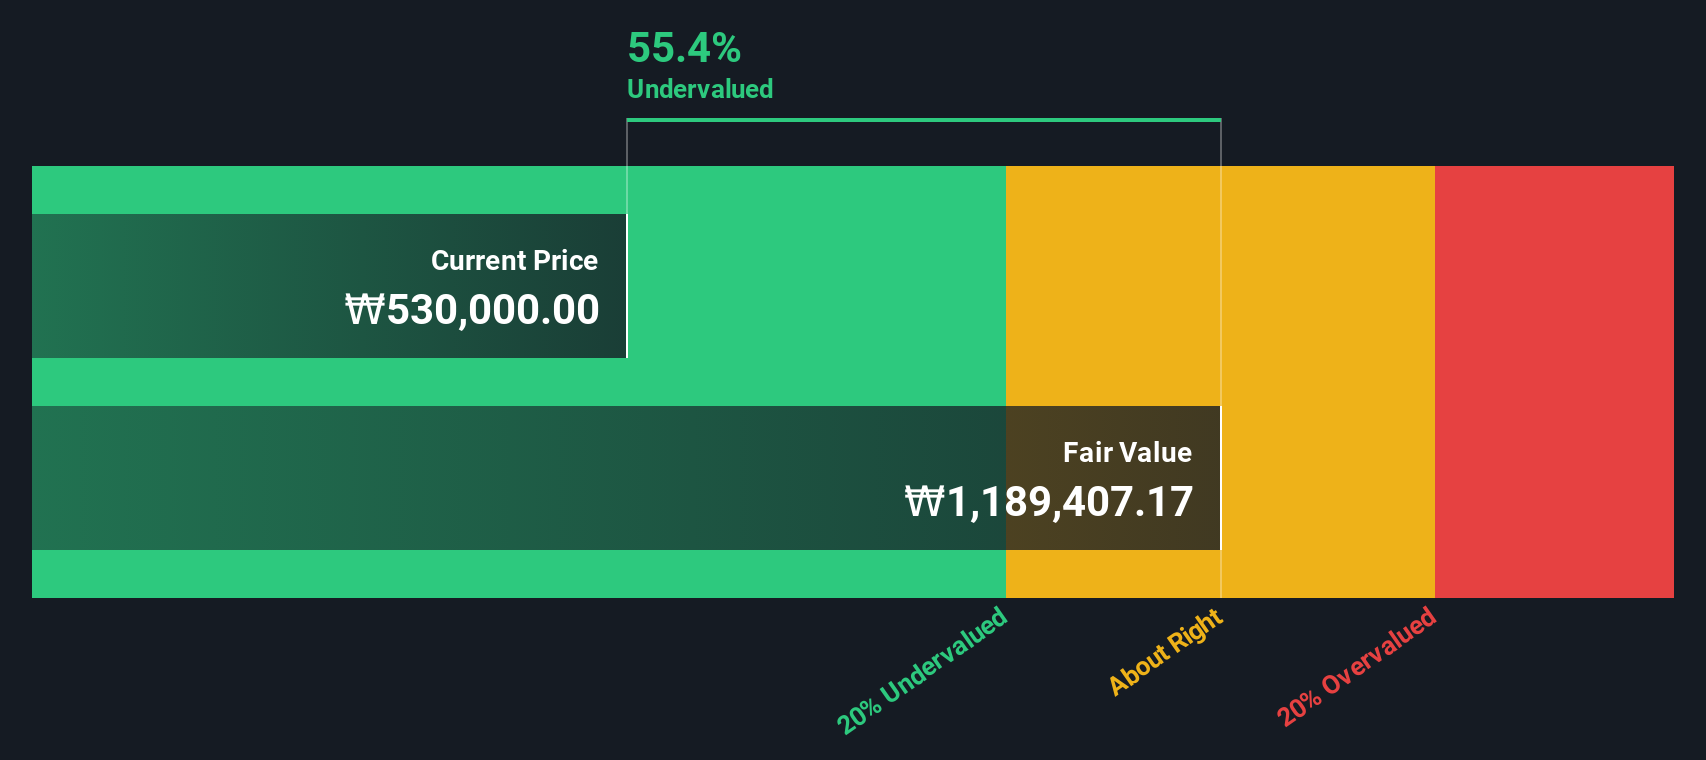
On this basis, SK hynix’s Free Cash Flow is projected to rise to around ₩105.9 trillion by 2035, with growth decelerating over time as the business matures. Those yearly cash flows are discounted to reflect risk and the time value of money, producing an estimated intrinsic value of roughly ₩1,326,303 per share.
Compared with the current share price, that implies the stock is about 56.0% undervalued. This suggests the market is still not fully pricing in SK hynix’s long term cash generation potential even after the strong rally.
Result: UNDERVALUED
Our Discounted Cash Flow (DCF) analysis suggests SK hynix is undervalued by 56.0%. Track this in your watchlist or portfolio, or discover 898 more undervalued stocks based on cash flows.
Approach 2: SK hynix Price vs Earnings
For profitable companies like SK hynix, the Price to Earnings (PE) ratio is a practical way to gauge whether investors are paying a reasonable price for each unit of current earnings. A higher PE can be justified when a company has stronger earnings growth prospects and lower perceived risk, while slower growth or higher uncertainty usually warrant a lower, more cautious multiple.
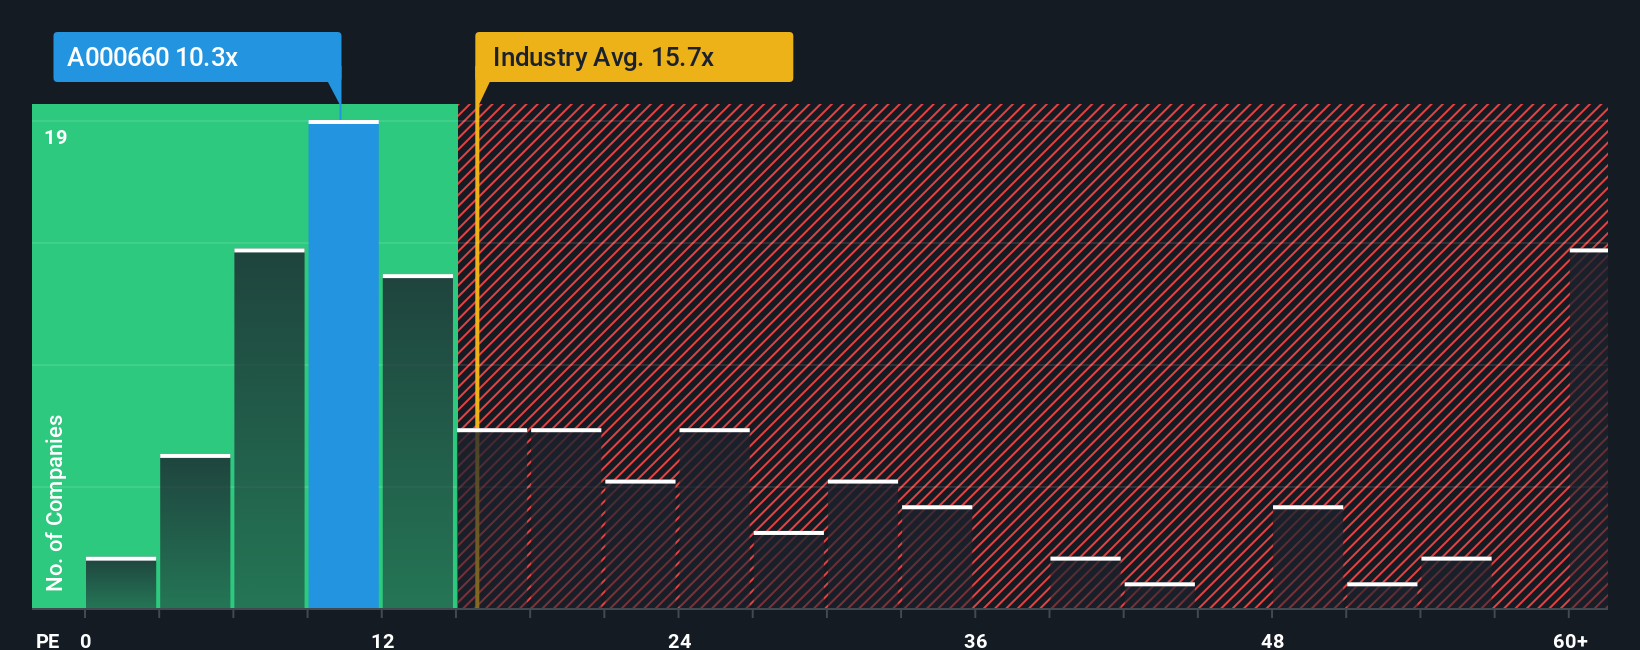
SK hynix currently trades on a PE of about 11.3x, which is below both the global Semiconductor industry average of around 16.5x and the peer group average of roughly 31.4x. Simply Wall St’s proprietary Fair Ratio for SK hynix is 32.9x, which reflects what investors might reasonably pay given its earnings growth outlook, profitability, size, industry position and risk profile. This Fair Ratio is more informative than a simple comparison with peers or industry averages because it explicitly factors in company specific fundamentals rather than just broad sector sentiment.
When we compare SK hynix’s current 11.3x PE to the Fair Ratio of 32.9x, the stock appears materially undervalued on an earnings multiple basis.
Result: UNDERVALUED
PE ratios tell one story, but what if the real opportunity lies elsewhere? Discover 1458 companies where insiders are betting big on explosive growth.
Upgrade Your Decision Making: Choose your SK hynix Narrative
Earlier we mentioned that there is an even better way to understand valuation, so let us introduce you to Narratives, a simple way to connect your view of SK hynix’s story with the numbers by turning your expectations for its future revenue, earnings and margins into a financial forecast and then a Fair Value that you can easily compare with today’s share price.
On Simply Wall St’s Community page, millions of investors use Narratives to do exactly this. They create their own story for a company, link that story to explicit forecasts, and then see whether the resulting Fair Value suggests they should consider buying, holding, or selling based on how it compares with the current market price.
Narratives are updated dynamically when new information such as news, guidance, or earnings is released. As a result, they stay relevant and can reflect very different perspectives for the same stock. For example, one SK hynix investor might plug in bullish assumptions close to the upper analyst targets around ₩400,000 per share, while a more cautious investor might lean toward the lower end near ₩255,245, each with a clear, numbers backed story that they can monitor and refine over time.
Do you think there's more to the story for SK hynix? Head over to our Community to see what others are saying!

This article by Simply Wall St is general in nature. We provide commentary based on historical data and analyst forecasts only using an unbiased methodology and our articles are not intended to be financial advice. It does not constitute a recommendation to buy or sell any stock, and does not take account of your objectives, or your financial situation. We aim to bring you long-term focused analysis driven by fundamental data. Note that our analysis may not factor in the latest price-sensitive company announcements or qualitative material. Simply Wall St has no position in any stocks mentioned.
Have feedback on this article? Concerned about the content? Get in touch with us directly. Alternatively, email editorial-team@simplywallst.com