
 Nasdaq
 華爾街日報
華爾街日報Is Honeywell Still Attractive After 2025 Automation Push And Recent Share Price Slump?
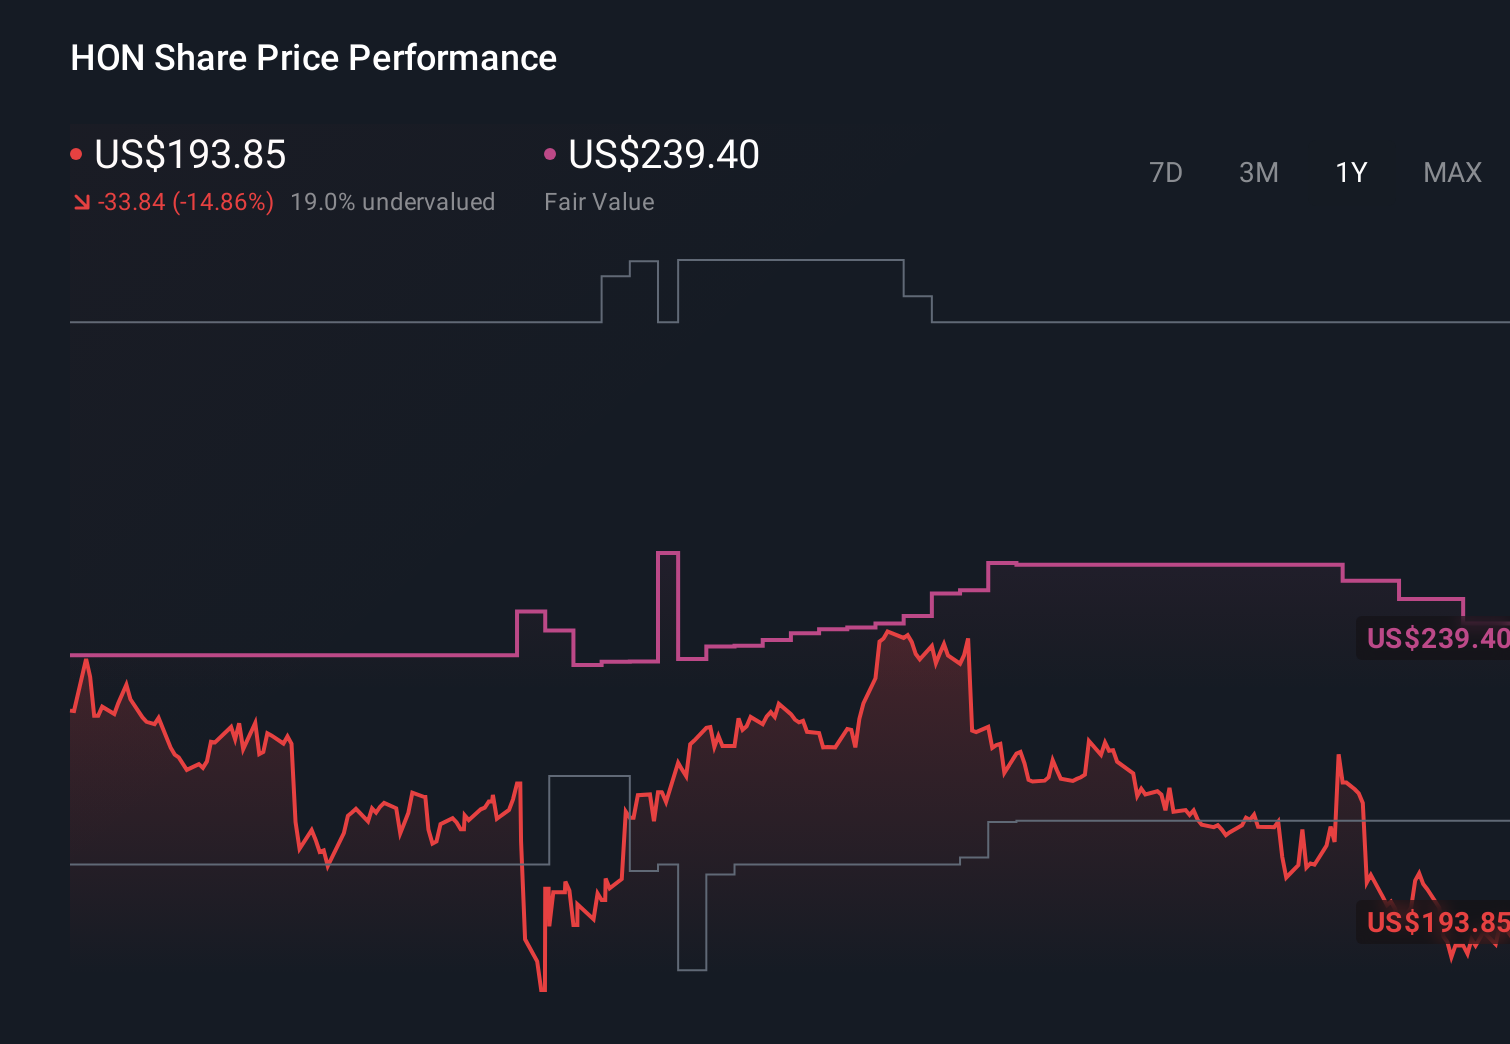
- If you are wondering whether Honeywell International is a bargain or a value trap at around $196 a share, you are not alone. This breakdown is designed to cut through the noise for long term investors.
- Despite being down 13.1% year to date and 6.4% over the last year, the stock has shown some resilience recently, with a 3.1% gain over the past month, even though it slipped 0.8% in the last week.
- Recent headlines have focused on Honeywell's push deeper into automation and digital industrial solutions, as well as continued portfolio reshaping through targeted acquisitions and divestitures. Together, these moves have helped investors reframe Honeywell less as a slow moving conglomerate and more as a higher quality, cash generative industrial technology platform.
- On our framework, Honeywell scores a solid 5/6 valuation score, suggesting it screens as undervalued on most of the key checks we run. Next, we will walk through what different valuation approaches are saying about the stock today, and finish by exploring a more holistic way to think about value that goes beyond the usual multiples and models.
Find out why Honeywell International's -6.4% return over the last year is lagging behind its peers.
Approach 1: Honeywell International Discounted Cash Flow (DCF) Analysis
A Discounted Cash Flow, or DCF, model estimates what a company is worth by projecting the cash it can generate in the future and then discounting those cash flows back to today in dollar terms.
For Honeywell, the 2 Stage Free Cash Flow to Equity model starts with last twelve months free cash flow of about $6.3 billion and builds out a glide path of growth. Analyst estimates cover the next few years, with free cash flow expected to reach roughly $7.2 billion by 2028. The remaining years in the 10 year forecast are extrapolated using Simply Wall St growth assumptions.
When these projected cash flows from 2026 through 2035 are discounted back to today, they imply an intrinsic value of about $248.49 per share. Compared with a recent share price around $196, the model suggests Honeywell is trading at roughly a 21.1% discount to its estimated fair value. On this basis, the stock appears attractively priced relative to these cash flow assumptions.
Result: UNDERVALUED
Our Discounted Cash Flow (DCF) analysis suggests Honeywell International is undervalued by 21.1%. Track this in your watchlist or portfolio, or discover 898 more undervalued stocks based on cash flows.

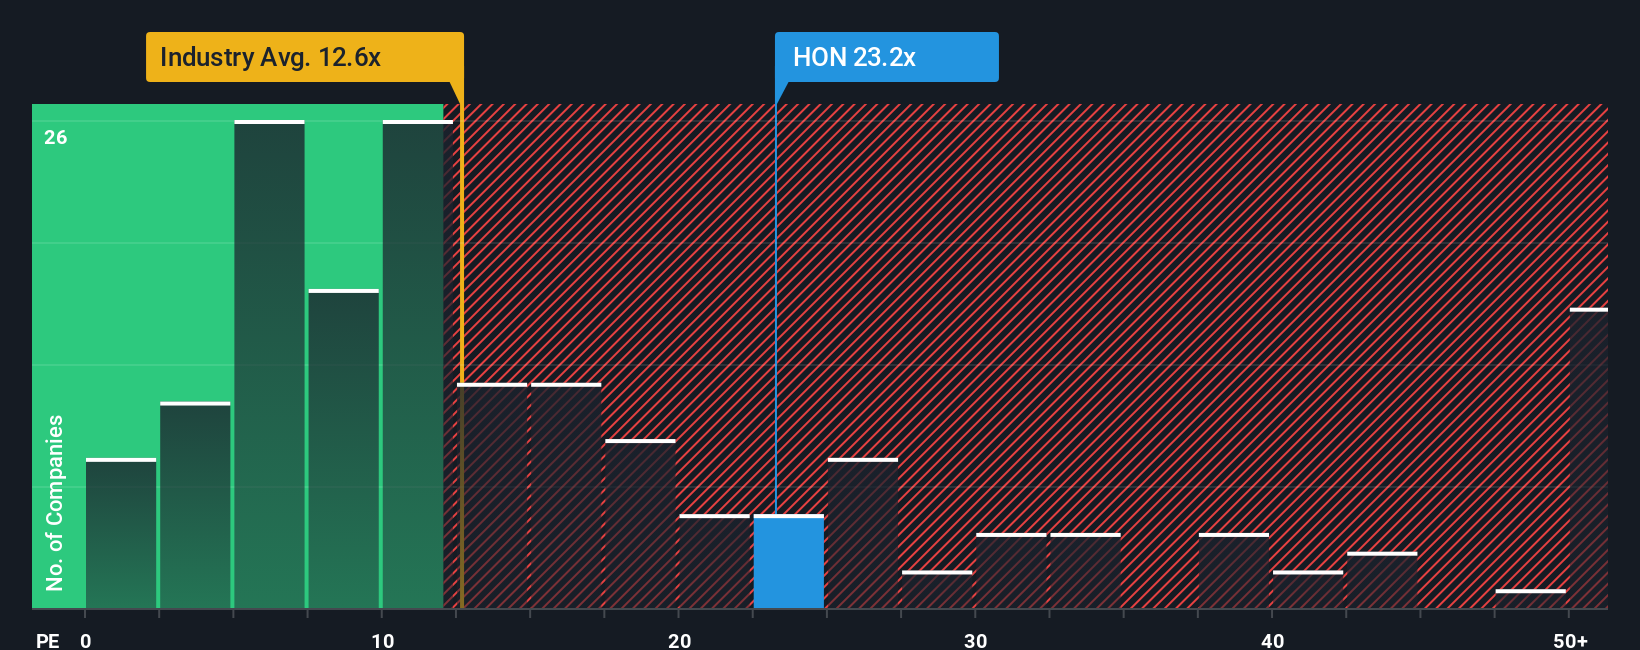
Approach 2: Honeywell International Price vs Earnings
For profitable, mature businesses like Honeywell, the price to earnings, or PE, ratio is a useful way to gauge value because it directly links what investors pay for the stock to the earnings the company generates today.
In practice, a higher multiple is usually justified for companies with stronger growth prospects and lower perceived risk, while slower growing or riskier businesses tend to trade on lower PE ratios. The challenge for investors is to work out what a reasonable, or fair, PE looks like for a specific company, given its outlook.
Honeywell currently trades on a PE of about 20.30x, which is above the broader Industrials sector average of roughly 12.12x but below the peer group average of around 28.51x. Simply Wall St also calculates a Fair Ratio of 28.48x for Honeywell, a proprietary estimate of what the PE should be given its earnings growth profile, margins, industry, size and risk. This Fair Ratio is more tailored than simple peer or industry comparisons because it adjusts for Honeywell’s specific fundamentals rather than assuming all companies deserve similar multiples. With the current 20.30x PE sitting well below the 28.48x Fair Ratio, the stock screens as undervalued on this metric.
Result: UNDERVALUED
PE ratios tell one story, but what if the real opportunity lies elsewhere? Discover 1457 companies where insiders are betting big on explosive growth.
Upgrade Your Decision Making: Choose your Honeywell International Narrative
Earlier we mentioned that there is an even better way to understand valuation, so let us introduce you to Narratives, a simple way to connect your view of Honeywell’s future with concrete numbers like revenue, earnings, margins and ultimately a Fair Value estimate. A Narrative is the story you believe about a company written into a financial forecast, linking what you think will happen in the business to a set of assumptions and an estimated fair value per share. On Simply Wall St’s Community page, millions of investors use Narratives as an accessible tool to capture their perspective and then compare the Fair Value that drops out of their forecast with today’s share price to help inform their decision. Narratives are dynamic, automatically updating when new news, earnings or guidance arrives so your story and valuation do not go stale. For Honeywell, for example, one investor might build a bullish Narrative around a $290 fair value driven by views on growth and successful separation, while another could anchor on a more cautious $203 fair value that incorporates tariff considerations and execution risks.
Do you think there's more to the story for Honeywell International? Head over to our Community to see what others are saying!
This article by Simply Wall St is general in nature. We provide commentary based on historical data and analyst forecasts only using an unbiased methodology and our articles are not intended to be financial advice. It does not constitute a recommendation to buy or sell any stock, and does not take account of your objectives, or your financial situation. We aim to bring you long-term focused analysis driven by fundamental data. Note that our analysis may not factor in the latest price-sensitive company announcements or qualitative material. Simply Wall St has no position in any stocks mentioned.
Have feedback on this article? Concerned about the content? Get in touch with us directly. Alternatively, email editorial-team@simplywallst.com