
 Nasdaq
 華爾街日報
華爾街日報Reassessing Lantheus Holdings After a 27.6% Slide and Recent Share Price Rebound
- Wondering if Lantheus Holdings is quietly turning into a bargain, or if the market already sees something you do not? Let us break down what the recent numbers are really saying about its value.
- The stock is down 27.6% over the last year and 25.8% year to date, but it has bounced 18.1% in the last month, a pattern that often signals investors are rethinking the story.
- That shift in sentiment comes as Lantheus continues to build on its diagnostics and radiopharmaceutical portfolio, including its flagship cardiac imaging agents and oncology-focused products. Investors are weighing how these developments could translate into more durable growth and justify a higher long term valuation.
- On our checks, Lantheus scores a 5/6 valuation score, suggesting it looks undervalued on most metrics, but not all. Next, we will walk through the main valuation approaches behind that score, and then finish with a more holistic way to judge whether the market is still mispricing this stock.
Find out why Lantheus Holdings's -27.6% return over the last year is lagging behind its peers.
Approach 1: Lantheus Holdings Discounted Cash Flow (DCF) Analysis
A Discounted Cash Flow model estimates what a business is worth today by projecting its future cash flows and discounting them back to the present. For Lantheus Holdings, the model uses a 2 Stage Free Cash Flow to Equity approach based on $271.3 Million in last twelve month free cash flow.
Analyst and extrapolated forecasts suggest free cash flow could rise to about $308 Million in 2026 and $457 Million by 2029, with further projections reaching roughly $632.2 Million by 2035. These cash flows, expressed in dollars, are discounted back using a required return to reflect risk and the time value of money.
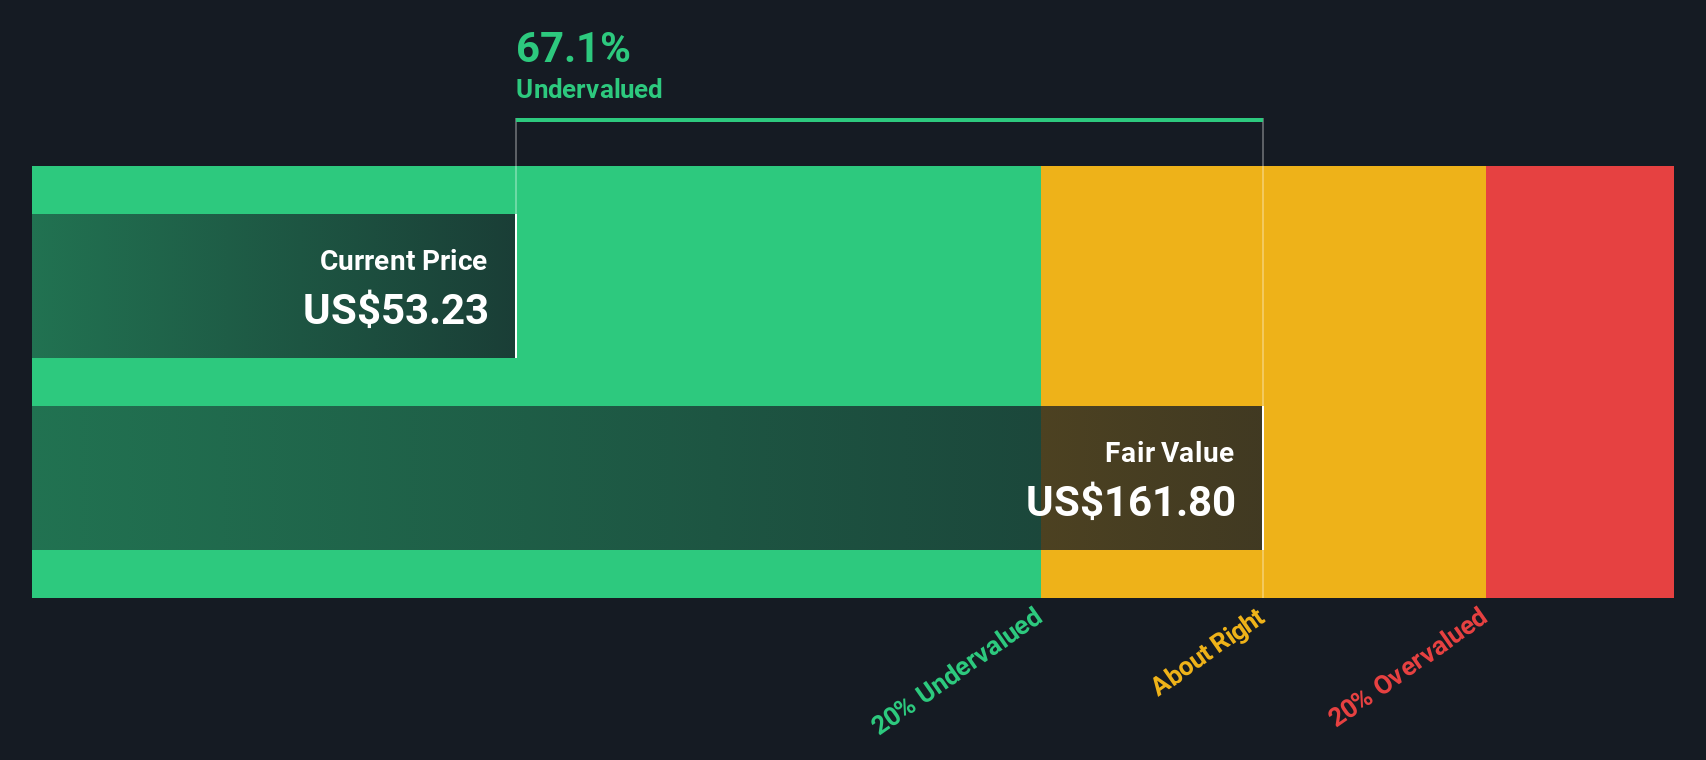
On this basis, the estimated intrinsic value for Lantheus is $143.65 per share. That implies the stock is trading at a 54.1% discount to its DCF fair value, which indicates that the market is pricing in a far weaker outlook than the cash flow projections suggest.
Result: UNDERVALUED
Our Discounted Cash Flow (DCF) analysis suggests Lantheus Holdings is undervalued by 54.1%. Track this in your watchlist or portfolio, or discover 909 more undervalued stocks based on cash flows.
Approach 2: Lantheus Holdings Price vs Earnings
For a profitable business like Lantheus Holdings, the price to earnings ratio is a useful way to judge how much investors are paying for each dollar of current earnings. In general, faster growing and less risky companies can justify a higher PE ratio, while slower growth or higher uncertainty should translate into a lower, more cautious multiple.
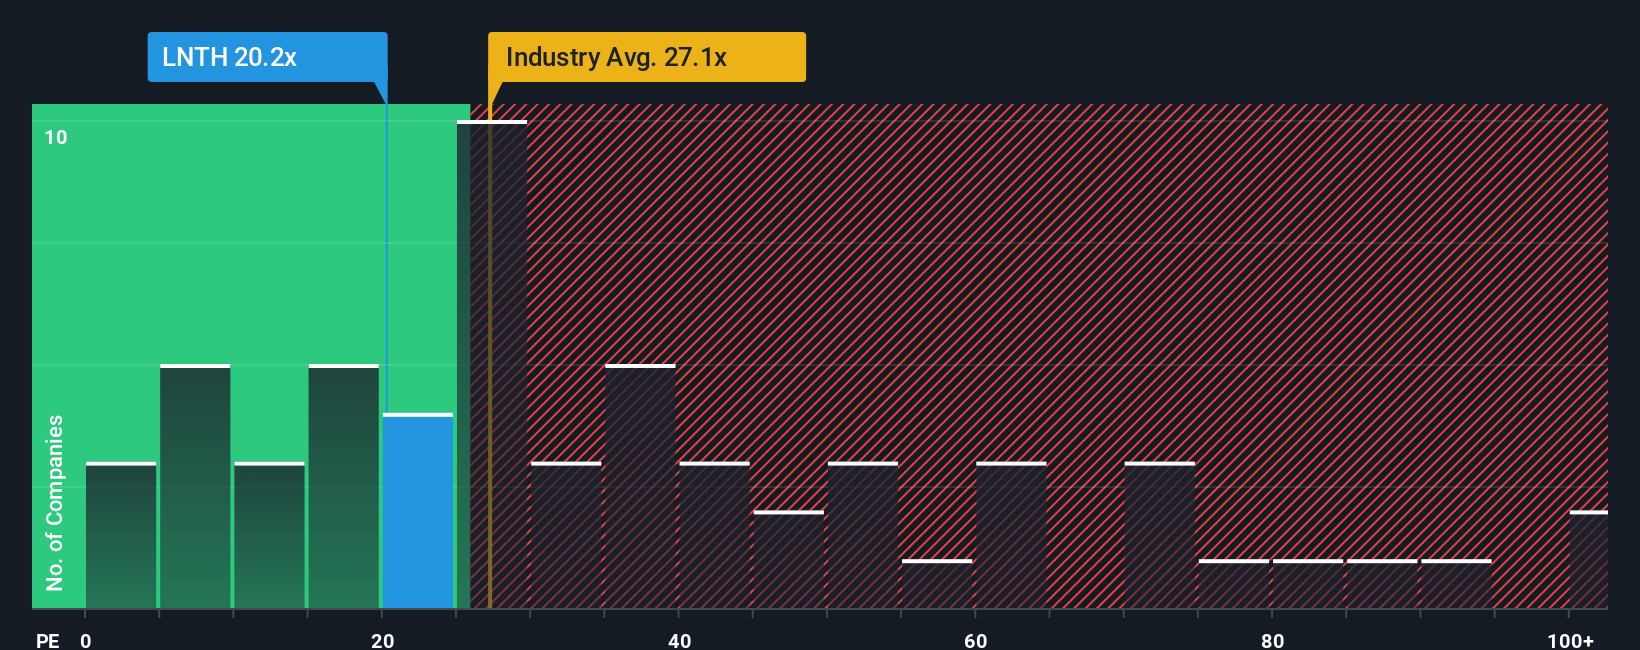
Lantheus currently trades on a PE of 26.1x, which is below both the Medical Equipment industry average of about 29.7x and the peer group average of roughly 30.6x. On the surface, that suggests the market is assigning a discount relative to similar businesses. However, Simply Wall St’s Fair Ratio framework goes a step further by estimating what a “normal” PE should be for Lantheus, given its specific earnings growth profile, profitability, industry, market capitalization and risk factors.
On this basis, Lantheus’ Fair Ratio is 30.6x, meaning the shares trade meaningfully below where they might reasonably sit if the market fully reflected those fundamentals. That gap supports the view that the stock still offers valuation upside when judged through the lens of earnings.
Result: UNDERVALUED
PE ratios tell one story, but what if the real opportunity lies elsewhere? Discover 1460 companies where insiders are betting big on explosive growth.
Upgrade Your Decision Making: Choose your Lantheus Holdings Narrative
Earlier we mentioned that there is an even better way to understand valuation, so let us introduce you to Narratives, a simple framework that lets you tell a clear story about Lantheus Holdings, connect that story to your own forecasts for revenue, earnings and margins, and then translate those forecasts into a Fair Value you can easily compare with the current share price to decide whether to buy, hold or sell.
In practice, a Narrative is your personal scenario for the company, linking what you believe about Lantheus’ Alzheimer’s and prostate cancer imaging opportunity, its pricing pressure, competition and acquisitions, into a set of numbers that roll into a valuation which automatically updates when new information like earnings, guidance changes or major news is released.
On Simply Wall St’s Community page, where millions of investors share their ideas, Narratives make this process accessible to everyone. One investor might build a more optimistic Lantheus Narrative that assumes margins climb toward the high 20s and justifies a Fair Value closer to 130 dollars. Another might take a cautious view with slower growth and heavier pricing pressure that supports something nearer 63 dollars, and the platform keeps both updated as the story evolves.
Do you think there's more to the story for Lantheus Holdings? Head over to our Community to see what others are saying!

This article by Simply Wall St is general in nature. We provide commentary based on historical data and analyst forecasts only using an unbiased methodology and our articles are not intended to be financial advice. It does not constitute a recommendation to buy or sell any stock, and does not take account of your objectives, or your financial situation. We aim to bring you long-term focused analysis driven by fundamental data. Note that our analysis may not factor in the latest price-sensitive company announcements or qualitative material. Simply Wall St has no position in any stocks mentioned.
Have feedback on this article? Concerned about the content? Get in touch with us directly. Alternatively, email editorial-team@simplywallst.com