
 Nasdaq
 華爾街日報
華爾街日報Interactive Brokers Group (IBKR): Valuation Check After the New IBKR GlobalTrader App Redesign and Tech Upgrades
Interactive Brokers Group (IBKR) just rolled out a redesigned IBKR GlobalTrader app, and that tech upgrade is exactly what has traders revisiting the stock, looking at how product execution ties into future growth.
See our latest analysis for Interactive Brokers Group.
The redesigned app lands after a steady run of fintech upgrades and geographic expansion, including new UAE equity access and IBKR Desktop enhancements. The share price now stands at $64.26, with momentum underpinned by a 40.84% year to date share price return and a 5 year total shareholder return of 332.77%, suggesting investors are increasingly willing to pay up for IBKR’s growth story.
If this kind of product driven rally has your attention, it could be worth scanning other fintech and platform names via fast growing stocks with high insider ownership to see where growth and insider conviction are lining up next.
With the stock up sharply this year yet still trading about 20% below average analyst targets, the key question now is whether Interactive Brokers remains mispriced growth or if the market is already discounting its next leg higher.
Most Popular Narrative: 16.9% Undervalued
With Interactive Brokers last closing at $64.26 against a narrative fair value near $77, the story leans on long term product and platform momentum.
The introduction of new products and enhancements, such as the strengthened ATS with new liquidity providers and order types, enhancements to the IBKR Financial Advisor Portal, and the launch of securities lending for Swedish stocks, suggests potential for increased trading activity and higher commission revenue.
Want to see why modest growth assumptions still support a richer valuation multiple than the sector? The narrative focuses on enduring margins and a premium future earnings multiple, not just headline top line forecasts. Curious which specific forecasts make that math work?
Result: Fair Value of $77.33 (UNDERVALUED)
Have a read of the narrative in full and understand what's behind the forecasts.
However, stretched valuations still face two key swing factors: a sharp drop in trading activity and faster than expected rate cuts that squeeze net interest income.
Find out about the key risks to this Interactive Brokers Group narrative.
Another Lens on Valuation
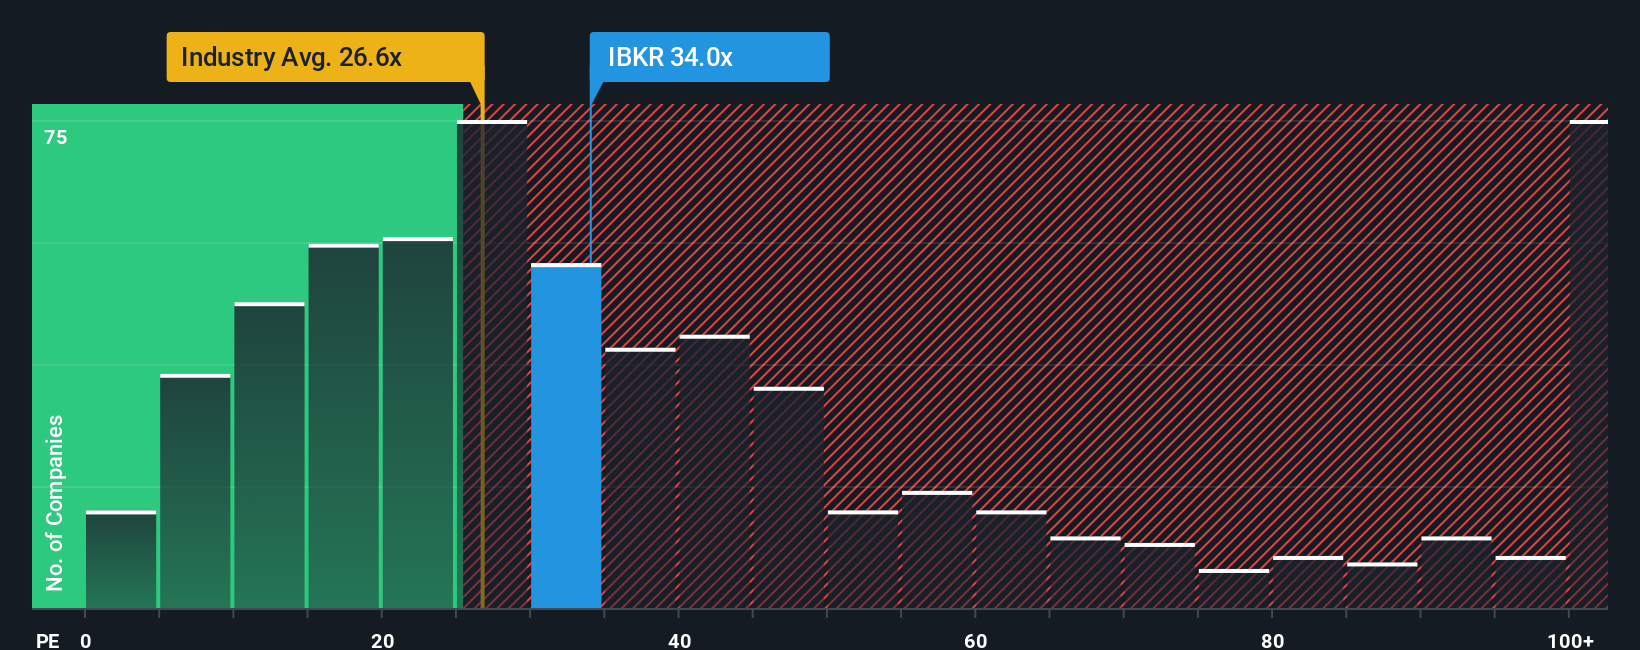
While the narrative fair value points to upside, our earnings based lens is much less forgiving. IBKR trades on a 31.2x earnings ratio versus 27x for peers and a 21.5x fair ratio, which implies investors are already paying a steep premium. How much multiple risk are you willing to own?
See what the numbers say about this price — find out in our valuation breakdown.
Build Your Own Interactive Brokers Group Narrative
If you see the story differently or want to dig into the numbers yourself, you can build a personalized view in just minutes: Do it your way.
A great starting point for your Interactive Brokers Group research is our analysis highlighting 3 key rewards and 1 important warning sign that could impact your investment decision.
Looking for more investment ideas?
Before you move on, put Simply Wall Street’s powerful screener to work and uncover fresh opportunities that match your strategy, instead of settling for the obvious names everyone already owns.
- Capture potential multi-baggers early by scanning these 3633 penny stocks with strong financials where solid financials support the possibility of outsized upside if sentiment and earnings surprise to the upside.
- Ride structural growth in automation and data by targeting these 24 AI penny stocks positioned at the heart of machine learning, cloud infrastructure, and intelligent software adoption.
- Find value-focused ideas using these 913 undervalued stocks based on cash flows that highlight companies trading below their estimated cash flow worth, before the broader market potentially closes the gap.
This article by Simply Wall St is general in nature. We provide commentary based on historical data and analyst forecasts only using an unbiased methodology and our articles are not intended to be financial advice. It does not constitute a recommendation to buy or sell any stock, and does not take account of your objectives, or your financial situation. We aim to bring you long-term focused analysis driven by fundamental data. Note that our analysis may not factor in the latest price-sensitive company announcements or qualitative material. Simply Wall St has no position in any stocks mentioned.
Have feedback on this article? Concerned about the content? Get in touch with us directly. Alternatively, email editorial-team@simplywallst.com