
 Nasdaq
 華爾街日報
華爾街日報Assessing Astellas Pharma (TSE:4503) Valuation After Its Strong 1-Year Share Price Rally
Astellas Pharma (TSE:4503) has quietly outperformed the broader Japanese market over the past year, gaining about 43% as investors warm to its oncology pipeline, steady cash generation, and improving long term return profile.
See our latest analysis for Astellas Pharma.
That momentum has not come out of nowhere, with a 90 day share price return of 26.7% and a 1 year total shareholder return of about 43% pointing to steadily improving sentiment rather than a brief spike.
If Astellas recent run has you rethinking healthcare exposure, it might be a good time to explore other potential opportunities across healthcare stocks and see what else fits your strategy.
But with the share price now well above last year’s levels and trading at a premium to some analyst targets, investors have to ask: is Astellas still undervalued or is the market already pricing in its future growth?
Most Popular Narrative Narrative: 17.2% Overvalued
With Astellas last closing at ¥2,100 against a narrative fair value of about ¥1,792, the story leans conservative relative to today’s price.
The analysts have a consensus price target of ¥1707.692 for Astellas Pharma based on their expectations of its future earnings growth, profit margins and other risk factors. However, there is a degree of disagreement amongst analysts, with the most bullish reporting a price target of ¥2200.0, and the most bearish reporting a price target of just ¥1300.0.
Want to see why modest revenue shrinkage can still sit beside rising profits and a richer future earnings multiple than the wider pharma sector? The full narrative unpacks how margin expansion, stable share count, and a premium multiple come together under a single discounted cash flow framework, using a specific hurdle rate to bridge today’s valuation to those 2028 earnings forecasts.
Result: Fair Value of ¥1,792.14 (OVERVALUED)
Have a read of the narrative in full and understand what's behind the forecasts.
However, persistent pricing pressure and looming patent expiries on key blockbusters could quickly erode margins and challenge the current premium valuation narrative.
Find out about the key risks to this Astellas Pharma narrative.
Another Angle on Valuation
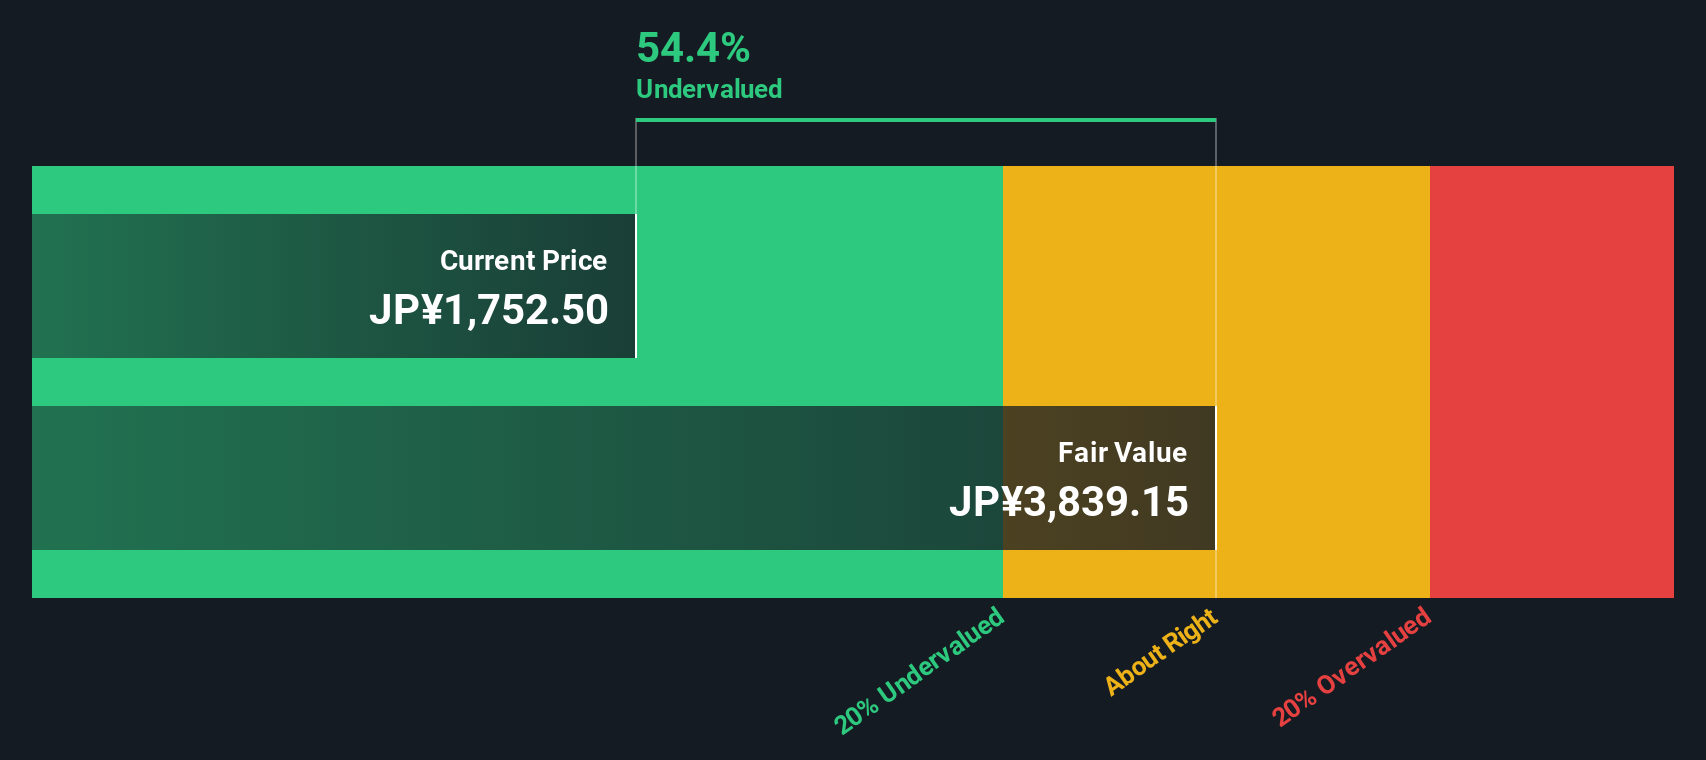
Our DCF model paints a very different picture, suggesting Astellas is trading about 49% below its fair value of roughly ¥4,142 per share. If cash flows really are that strong, is the market underestimating long term compounding, or is the model too optimistic?
Look into how the SWS DCF model arrives at its fair value.
Simply Wall St performs a discounted cash flow (DCF) on every stock in the world every day (check out Astellas Pharma for example). We show the entire calculation in full. You can track the result in your watchlist or portfolio and be alerted when this changes, or use our stock screener to discover 913 undervalued stocks based on their cash flows. If you save a screener we even alert you when new companies match - so you never miss a potential opportunity.
Build Your Own Astellas Pharma Narrative
If you see the story differently or prefer to dig into the numbers yourself, you can build a custom view in just a few minutes: Do it your way.
A great starting point for your Astellas Pharma research is our analysis highlighting 3 key rewards and 2 important warning signs that could impact your investment decision.
Ready for your next investing move?
Before you stop at Astellas, put Simply Wall Street’s Screener to work so you do not leave high potential ideas and future returns on the table.
- Capture mispriced opportunities early by acting on these 913 undervalued stocks based on cash flows that could offer stronger upside than well known blue chips.
- Position your portfolio for innovation waves by backing these 24 AI penny stocks at the forefront of real world artificial intelligence adoption.
- Lock in reliable cash flow potential with these 12 dividend stocks with yields > 3% that can help steady overall returns when markets turn volatile.
This article by Simply Wall St is general in nature. We provide commentary based on historical data and analyst forecasts only using an unbiased methodology and our articles are not intended to be financial advice. It does not constitute a recommendation to buy or sell any stock, and does not take account of your objectives, or your financial situation. We aim to bring you long-term focused analysis driven by fundamental data. Note that our analysis may not factor in the latest price-sensitive company announcements or qualitative material. Simply Wall St has no position in any stocks mentioned.
Have feedback on this article? Concerned about the content? Get in touch with us directly. Alternatively, email editorial-team@simplywallst.com