
 Nasdaq
 華爾街日報
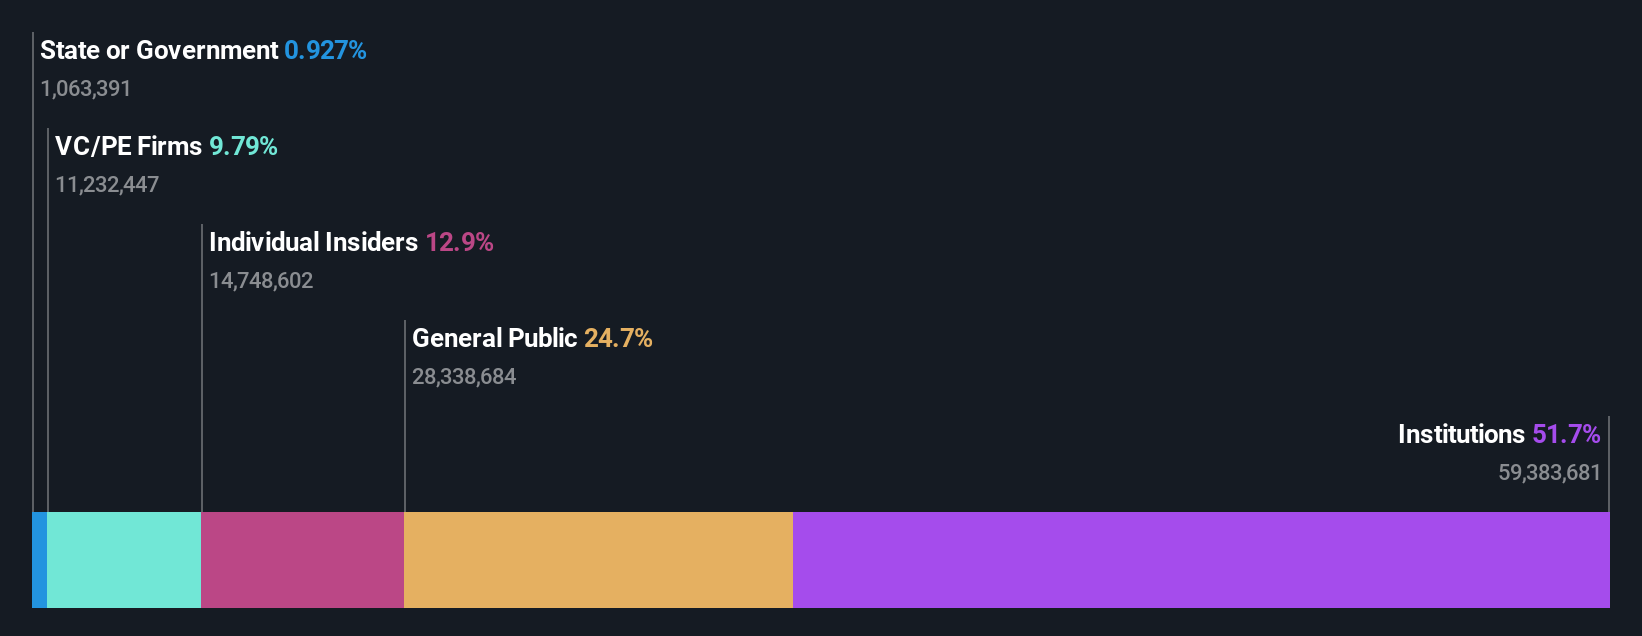
華爾街日報With 52% ownership of the shares, BBB Foods Inc. (NYSE:TBBB) is heavily dominated by institutional owners
Key Insights
- Significantly high institutional ownership implies BBB Foods' stock price is sensitive to their trading actions
- A total of 9 investors have a majority stake in the company with 52% ownership
- Insider ownership in BBB Foods is 13%
A look at the shareholders of BBB Foods Inc. (NYSE:TBBB) can tell us which group is most powerful. We can see that institutions own the lion's share in the company with 52% ownership. In other words, the group stands to gain the most (or lose the most) from their investment into the company.
Since institutional have access to huge amounts of capital, their market moves tend to receive a lot of scrutiny by retail or individual investors. As a result, a sizeable amount of institutional money invested in a firm is generally viewed as a positive attribute.
Let's take a closer look to see what the different types of shareholders can tell us about BBB Foods.
See our latest analysis for BBB Foods
What Does The Institutional Ownership Tell Us About BBB Foods?
Institutions typically measure themselves against a benchmark when reporting to their own investors, so they often become more enthusiastic about a stock once it's included in a major index. We would expect most companies to have some institutions on the register, especially if they are growing.
We can see that BBB Foods does have institutional investors; and they hold a good portion of the company's stock. This implies the analysts working for those institutions have looked at the stock and they like it. But just like anyone else, they could be wrong. It is not uncommon to see a big share price drop if two large institutional investors try to sell out of a stock at the same time. So it is worth checking the past earnings trajectory of BBB Foods, (below). Of course, keep in mind that there are other factors to consider, too.

Investors should note that institutions actually own more than half the company, so they can collectively wield significant power. BBB Foods is not owned by hedge funds. Looking at our data, we can see that the largest shareholder is Capital Research and Management Company with 12% of shares outstanding. In comparison, the second and third largest shareholders hold about 9.8% and 9.6% of the stock. Kamal Hatoum, who is the third-largest shareholder, also happens to hold the title of Chairman of the Board.
On further inspection, we found that more than half the company's shares are owned by the top 9 shareholders, suggesting that the interests of the larger shareholders are balanced out to an extent by the smaller ones.
While studying institutional ownership for a company can add value to your research, it is also a good practice to research analyst recommendations to get a deeper understand of a stock's expected performance. Quite a few analysts cover the stock, so you could look into forecast growth quite easily.
Insider Ownership Of BBB Foods
While the precise definition of an insider can be subjective, almost everyone considers board members to be insiders. Management ultimately answers to the board. However, it is not uncommon for managers to be executive board members, especially if they are a founder or the CEO.
Most consider insider ownership a positive because it can indicate the board is well aligned with other shareholders. However, on some occasions too much power is concentrated within this group.
Our information suggests that insiders maintain a significant holding in BBB Foods Inc.. It has a market capitalization of just US$3.9b, and insiders have US$497m worth of shares in their own names. That's quite significant. Most would be pleased to see the board is investing alongside them. You may wish to access this free chart showing recent trading by insiders.
General Public Ownership
The general public, who are usually individual investors, hold a 25% stake in BBB Foods. This size of ownership, while considerable, may not be enough to change company policy if the decision is not in sync with other large shareholders.
Private Equity Ownership
With a stake of 9.8%, private equity firms could influence the BBB Foods board. Sometimes we see private equity stick around for the long term, but generally speaking they have a shorter investment horizon and -- as the name suggests -- don't invest in public companies much. After some time they may look to sell and redeploy capital elsewhere.
Next Steps:
I find it very interesting to look at who exactly owns a company. But to truly gain insight, we need to consider other information, too.
Many find it useful to take an in depth look at how a company has performed in the past. You can access this detailed graph of past earnings, revenue and cash flow.
If you are like me, you may want to think about whether this company will grow or shrink. Luckily, you can check this free report showing analyst forecasts for its future.
NB: Figures in this article are calculated using data from the last twelve months, which refer to the 12-month period ending on the last date of the month the financial statement is dated. This may not be consistent with full year annual report figures.
Have feedback on this article? Concerned about the content? Get in touch with us directly. Alternatively, email editorial-team (at) simplywallst.com.
This article by Simply Wall St is general in nature. We provide commentary based on historical data and analyst forecasts only using an unbiased methodology and our articles are not intended to be financial advice. It does not constitute a recommendation to buy or sell any stock, and does not take account of your objectives, or your financial situation. We aim to bring you long-term focused analysis driven by fundamental data. Note that our analysis may not factor in the latest price-sensitive company announcements or qualitative material. Simply Wall St has no position in any stocks mentioned.