
 Nasdaq
 華爾街日報
華爾街日報Does Coupang’s Recent Pullback Offer Value as DCF and PE Send Mixed Signals?
- Wondering if Coupang's current share price actually reflects its long term potential, or if the market is missing something? This breakdown will walk you through what the numbers are really saying.
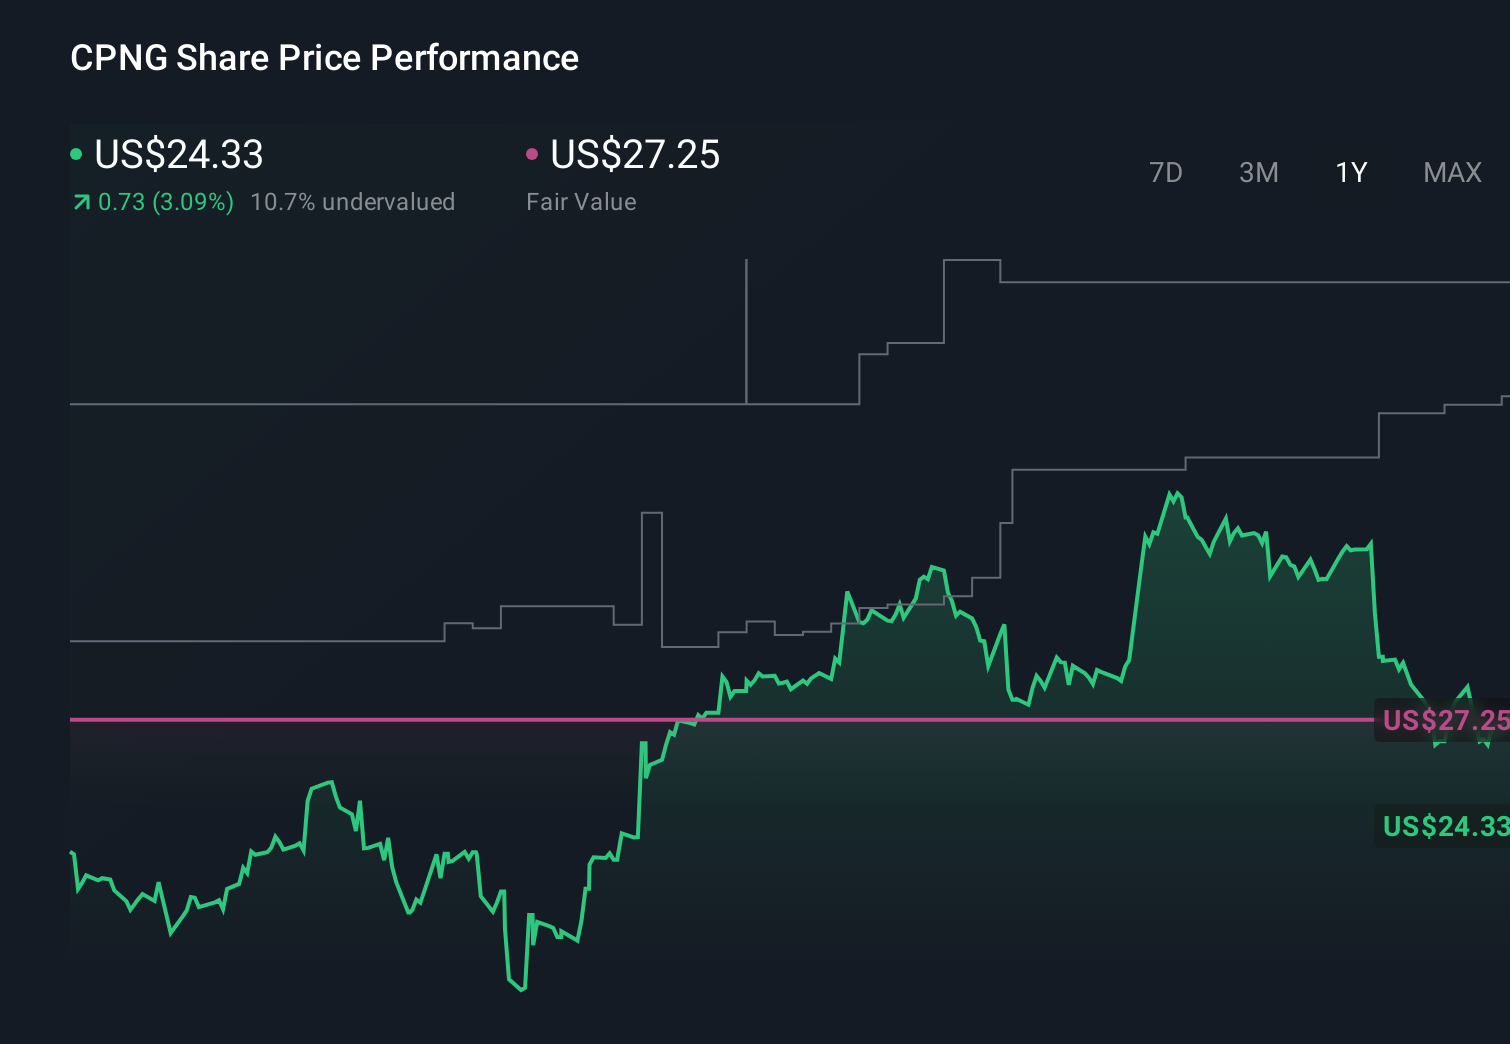
- Despite being up 53.3% over the last 3 years, the stock has been choppy lately, slipping 9.5% over the past week and 13.0% over the last month, while still clinging to a modest 4.1% gain year to date.
- Recent headlines have focused on Coupang's ongoing push to deepen its logistics moat in Korea and expand higher margin services, alongside continued investment in new categories and regional growth. At the same time, commentary around competition in Korean e commerce and consumer spending trends has added a layer of uncertainty to how investors are pricing its future growth.
- Right now, Coupang scores a 3/6 valuation check, which means it screens as undervalued on half of our key metrics. That is only part of the story though. Next we will unpack the different valuation methods behind that score and finish with a more complete way to judge what the stock might really be worth.
Find out why Coupang's 1.1% return over the last year is lagging behind its peers.
Approach 1: Coupang Discounted Cash Flow (DCF) Analysis
A Discounted Cash Flow (DCF) model estimates what a company is worth by projecting its future cash flows and then discounting them back to today, using a required rate of return. For Coupang, the model used is a 2 Stage Free Cash Flow to Equity approach, based on its ability to generate cash for shareholders.
Coupang generated about $1.27 billion in free cash flow over the last twelve months. Analysts project free cash flow to rise to roughly $2.44 billion by 2027, with further growth extending over the following years using Simply Wall St extrapolations. These ten year projections gradually slow from higher growth in the near term to more moderate gains later on, reflecting a maturing business that is still expanding but at a steadier pace.
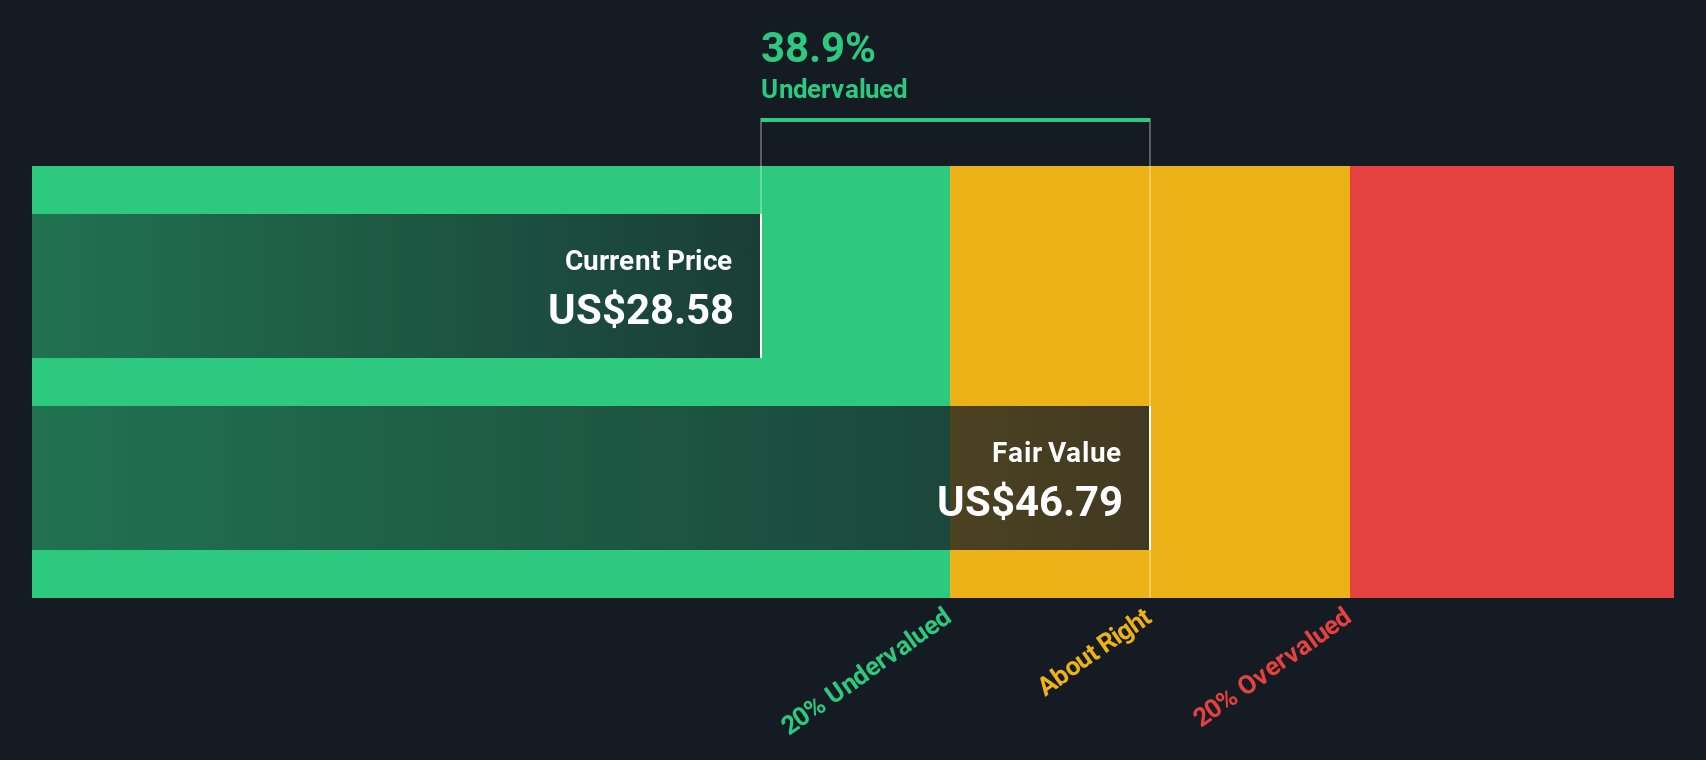
Discounting all of these future cash flows back to today results in an estimated intrinsic value of $36.46 per share. Compared to the current market price, this implies Coupang is trading at about a 36.4% discount, suggesting potential upside if these cash flow assumptions play out.
Result: UNDERVALUED
Our Discounted Cash Flow (DCF) analysis suggests Coupang is undervalued by 36.4%. Track this in your watchlist or portfolio, or discover 914 more undervalued stocks based on cash flows.
Approach 2: Coupang Price vs Earnings
For profitable companies like Coupang, the price to earnings (PE) ratio is a useful way to see how much investors are willing to pay today for each dollar of current earnings. It quickly links the share price to the underlying profitability of the business.
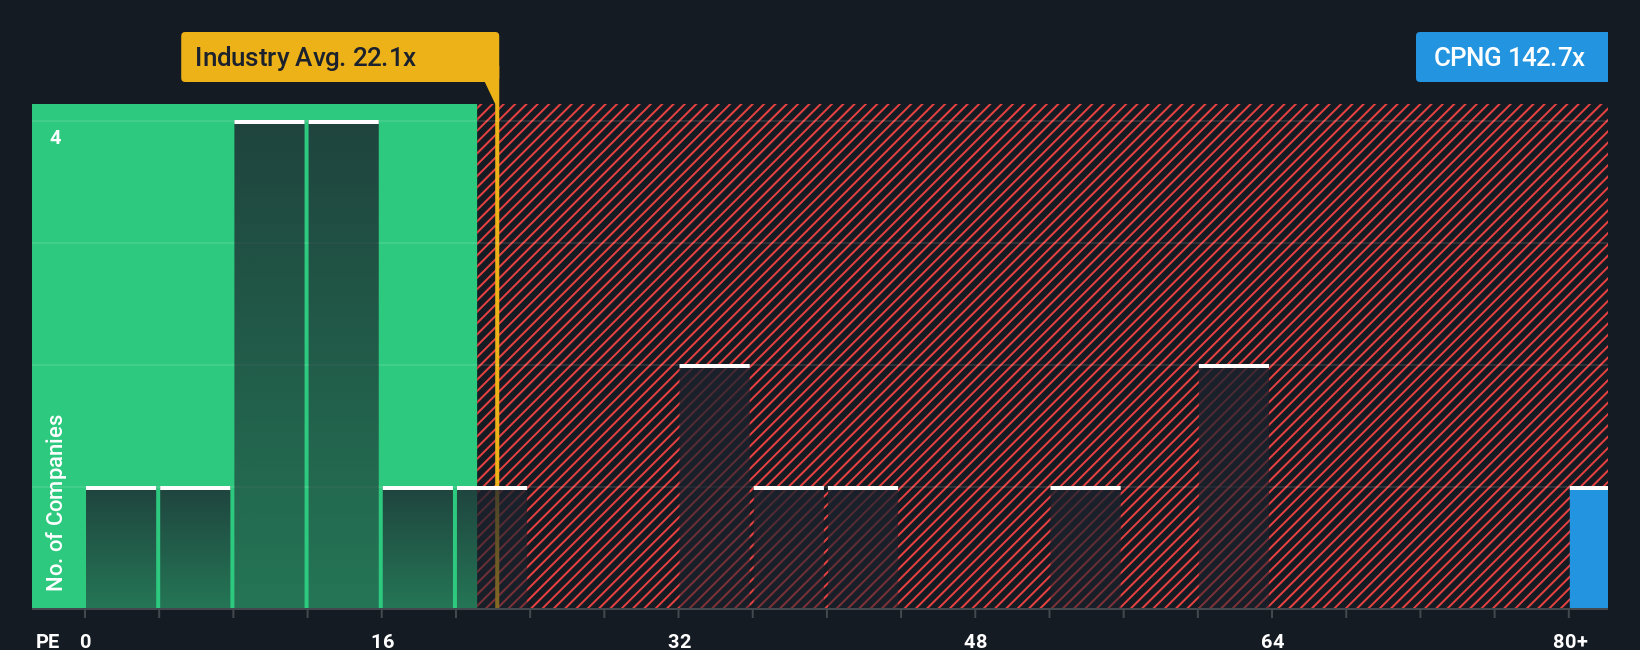
What counts as a fair PE depends on how fast earnings are expected to grow and how risky that growth looks. Higher growth and more predictable cash flows can justify a higher multiple, while slower or riskier growth usually deserves a discount. Coupang currently trades on a PE of about 108.7x, which is well above the multiline retail industry average of roughly 19.6x and also richer than the peer group average of around 31.6x.
Simply Wall St’s Fair Ratio is a proprietary estimate of what PE multiple Coupang should trade on, after accounting for its earnings growth outlook, industry, profit margins, market cap and key risks. Because it blends these fundamentals rather than relying on broad group averages, it provides a more tailored benchmark than simple peer or sector comparisons. For Coupang, the Fair Ratio is 42.1x, meaning the current 108.7x PE looks stretched relative to what its fundamentals justify.
Result: OVERVALUED
PE ratios tell one story, but what if the real opportunity lies elsewhere? Discover 1463 companies where insiders are betting big on explosive growth.
Upgrade Your Decision Making: Choose your Coupang Narrative
Earlier we mentioned that there is an even better way to understand valuation, so let us introduce you to Narratives, a simple way to attach your own story about Coupang to concrete numbers like future revenue, earnings, margins and fair value, then compare that fair value to today’s share price. A Narrative on Simply Wall St is your view of how the business will actually evolve, translated into a structured forecast and a fair value estimate, so the company’s story, the numbers and the decision to buy, hold or sell are all joined together. Narratives live in the Community page on the platform, where millions of investors can create and browse different perspectives, and each one updates dynamically when new information like earnings or major news hits, so it never goes stale. For Coupang, one investor might build a more conservative Narrative that sees fair value closer to about 27 dollars, assuming slower growth and thinner margins. Another might lean into its logistics moat and international expansion and land near 36 dollars. That spread helps you decide which story you believe and whether today’s price offers enough upside.
Do you think there's more to the story for Coupang? Head over to our Community to see what others are saying!
This article by Simply Wall St is general in nature. We provide commentary based on historical data and analyst forecasts only using an unbiased methodology and our articles are not intended to be financial advice. It does not constitute a recommendation to buy or sell any stock, and does not take account of your objectives, or your financial situation. We aim to bring you long-term focused analysis driven by fundamental data. Note that our analysis may not factor in the latest price-sensitive company announcements or qualitative material. Simply Wall St has no position in any stocks mentioned.
Have feedback on this article? Concerned about the content? Get in touch with us directly. Alternatively, email editorial-team@simplywallst.com