
 Nasdaq
 華爾街日報
華爾街日報Is Phillips 66 Still Attractive After Big Multi Year Gains And Recent Share Price Pullback
- If you are wondering whether Phillips 66 is still good value after its strong run, or if most of the upside is already priced in, this article will walk through what the numbers are really saying about the stock.
- Despite gaining 128.0% over the past 5 years and 21.2% over the last year, the share price has cooled recently. It is up 12.7% year to date but has pulled back 8.9% over the past week and 3.6% over the last month.
- Recent headlines have focused on strategy, capital returns, and the evolving energy mix, with investors paying close attention to how Phillips 66 balances traditional refining with growth opportunities in midstream and chemicals. The market has been reacting to these narrative shifts, which helps explain both the strong multi year performance and the short term volatility.
- On our valuation framework, Phillips 66 scores a 2/6 for being undervalued across key checks, suggesting some metrics flag upside while others point to caution. We will unpack those signals using multiple valuation approaches before finishing with a more holistic way to judge what the stock is really worth.
Phillips 66 scores just 2/6 on our valuation checks. See what other red flags we found in the full valuation breakdown.
Approach 1: Phillips 66 Discounted Cash Flow (DCF) Analysis
A Discounted Cash Flow (DCF) model estimates what a company is worth by projecting the cash it can return to shareholders in the future and then discounting those cash flows back to today.
For Phillips 66, the latest twelve month Free Cash Flow is about $1.48 billion, and analysts see this rising sharply over time, with Simply Wall St extrapolating their estimates so that projected Free Cash Flow reaches roughly $9.16 billion by 2035. The near term projections out to 2029 already show Free Cash Flow climbing into the mid to high single digit billions of dollars, before growth moderates in the second stage of the model.
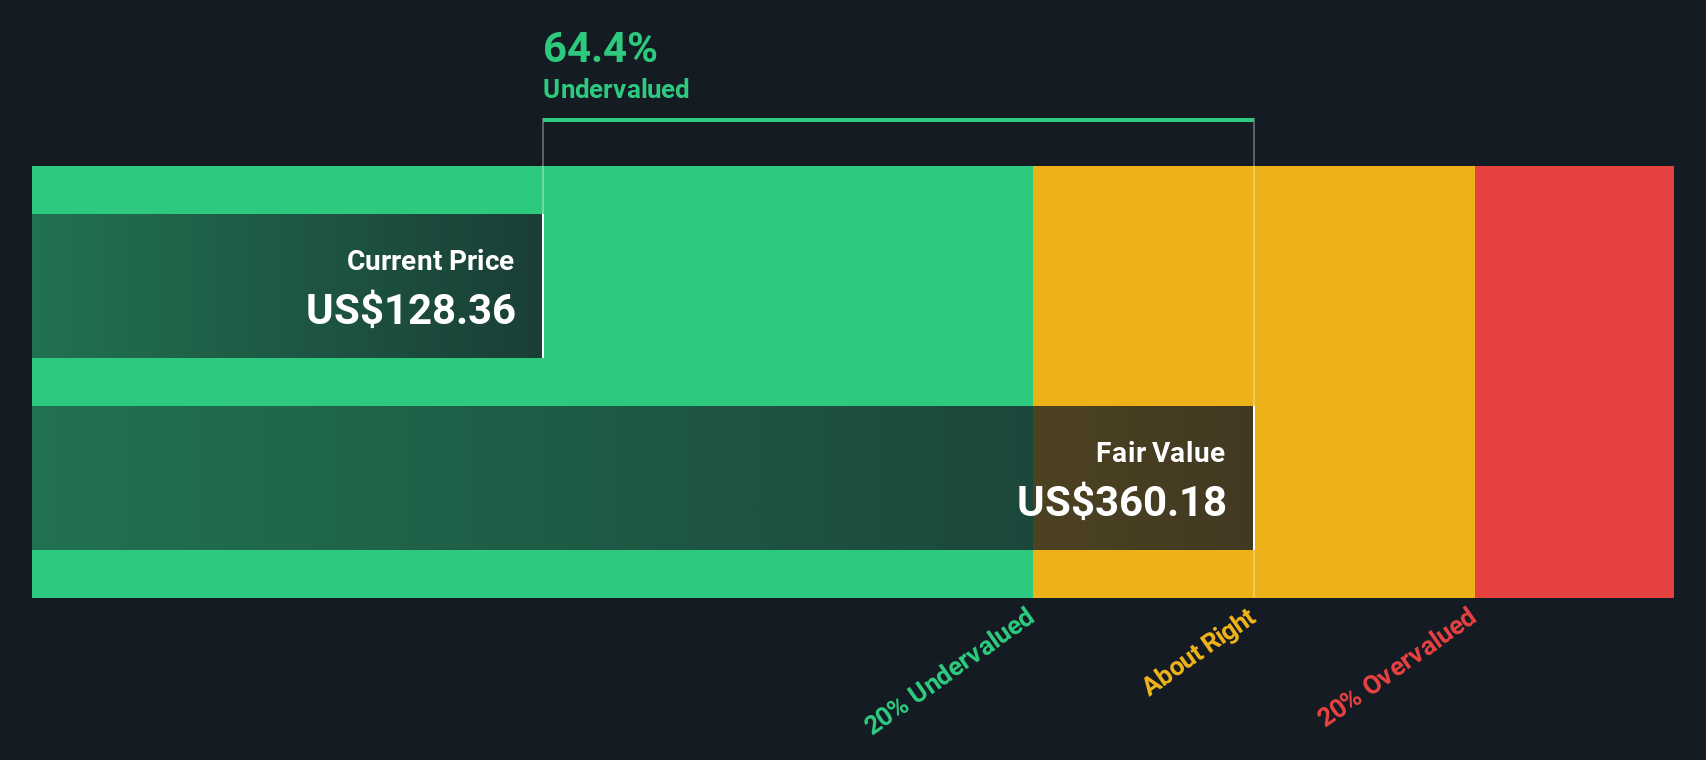
Using this two stage Free Cash Flow to Equity approach, the model arrives at an intrinsic value of about $444.72 per share. Compared with the current share price, this implies the stock is roughly 71.0% undervalued, suggesting the market is heavily discounting Phillips 66 relative to its projected cash generation.
Result: UNDERVALUED
Our Discounted Cash Flow (DCF) analysis suggests Phillips 66 is undervalued by 71.0%. Track this in your watchlist or portfolio, or discover 914 more undervalued stocks based on cash flows.
Approach 2: Phillips 66 Price vs Earnings
For a mature, profitable business like Phillips 66, the Price to Earnings (PE) ratio is a useful yardstick because it links what investors pay today with the company’s current earnings power. In general, faster growing and lower risk companies deserve a higher PE, while slower growth or higher uncertainty should translate into a lower, more conservative multiple.
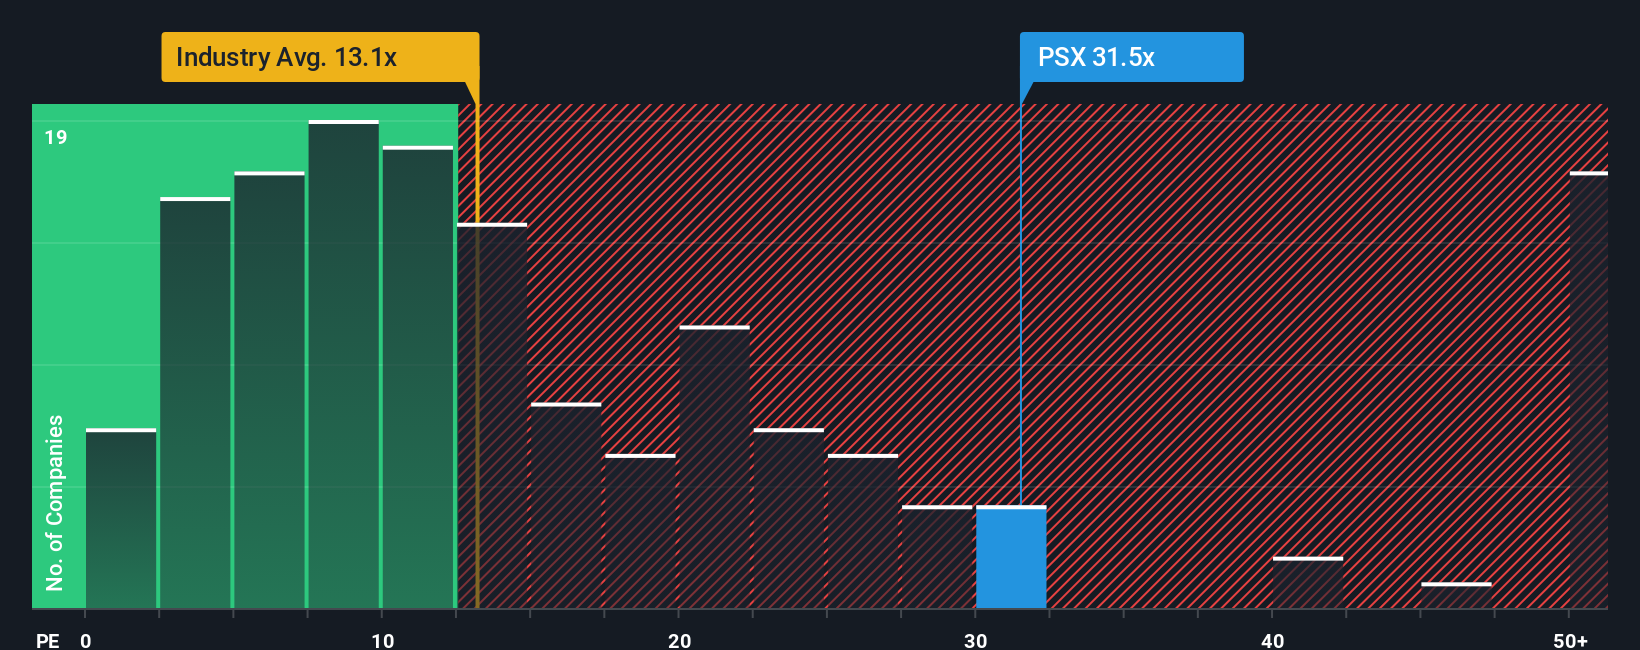
Phillips 66 currently trades on a PE of about 34.7x, well above the broader Oil and Gas industry average of roughly 12.8x and also higher than its peer group average of around 24.4x. To go beyond these blunt comparisons, Simply Wall St uses a proprietary “Fair Ratio,” which estimates the PE a company should trade on after factoring in its earnings growth outlook, risk profile, profit margins, industry characteristics and market capitalization.
For Phillips 66, this Fair Ratio is 24.6x, which is meaningfully below the current 34.7x multiple. Because the stock’s PE sits well above what the Fair Ratio suggests is appropriate, it indicates that, on earnings alone, the market is paying a premium that looks stretched.
Result: OVERVALUED
PE ratios tell one story, but what if the real opportunity lies elsewhere? Discover 1464 companies where insiders are betting big on explosive growth.
Upgrade Your Decision Making: Choose your Phillips 66 Narrative
Earlier we mentioned that there is an even better way to understand valuation, so let us introduce you to Narratives, a simple framework that lets you attach a clear story to your numbers by defining your own view of a company’s future revenue, earnings, and margins, and then translating that into a fair value you can compare with today’s share price.
On Simply Wall St’s Community page, Narratives are an accessible tool used by millions of investors to connect a company’s story to a financial forecast. Instead of just looking at static multiples, you can see whether your fair value estimate suggests a stock could be considered a buy, hold, or sell at the current price, and then watch that view update dynamically as new news, earnings, or guidance comes in.
For Phillips 66, for example, one Narrative might assume moderate 3.0% revenue growth, 4.0% profit margins and a fair value around $268.71 per share. Another, more cautious Narrative might assume slightly declining revenue, 4.18% margins and a fair value closer to $149.35. This gives you a clear, side by side picture of how different perspectives can lead to very different investment decisions.
Do you think there's more to the story for Phillips 66? Head over to our Community to see what others are saying!

This article by Simply Wall St is general in nature. We provide commentary based on historical data and analyst forecasts only using an unbiased methodology and our articles are not intended to be financial advice. It does not constitute a recommendation to buy or sell any stock, and does not take account of your objectives, or your financial situation. We aim to bring you long-term focused analysis driven by fundamental data. Note that our analysis may not factor in the latest price-sensitive company announcements or qualitative material. Simply Wall St has no position in any stocks mentioned.
Have feedback on this article? Concerned about the content? Get in touch with us directly. Alternatively, email editorial-team@simplywallst.com