
 Nasdaq
 華爾街日報
華爾街日報Has CenterPoint’s Strong 5 Year Run Left Much Upside for Investors in 2025
- Wondering if CenterPoint Energy at around $37.60 is still worth buying after its strong run, or if the easy money has already been made? Let us break it down in plain English before we dive into the valuation models.
- The stock has cooled off in the short term, slipping about 0.6% over the last week and 5.0% over the last month, yet it still boasts gains of 19.4% year to date and 18.3% over the past year, nearly doubling investors' money with a 98.3% return over five years.
- Recently, CenterPoint has stayed in focus as investors watch how regulated utilities navigate ongoing grid modernization spending and the broader interest rate backdrop, both of which can reshape expectations for future cash flows and dividends. At the same time, regulatory developments in its core service territories and ongoing infrastructure investment plans have helped frame the stock as a steadier, lower drama play within the utilities space.
- Despite that track record, CenterPoint currently scores 0 out of 6 on our undervaluation checks, as shown by its valuation score. The real question is whether traditional metrics are missing something about its long term potential or risk profile. We will explore both the usual valuation approaches and a more nuanced way of thinking about value by the end of this article.
CenterPoint Energy scores just 0/6 on our valuation checks. See what other red flags we found in the full valuation breakdown.
Approach 1: CenterPoint Energy Dividend Discount Model (DDM) Analysis
The Dividend Discount Model estimates what a stock is worth by projecting all future dividends, assuming a steady growth rate, and discounting those payments back to today. It is a natural fit for regulated utilities like CenterPoint Energy, where dividends are a key part of shareholder returns.
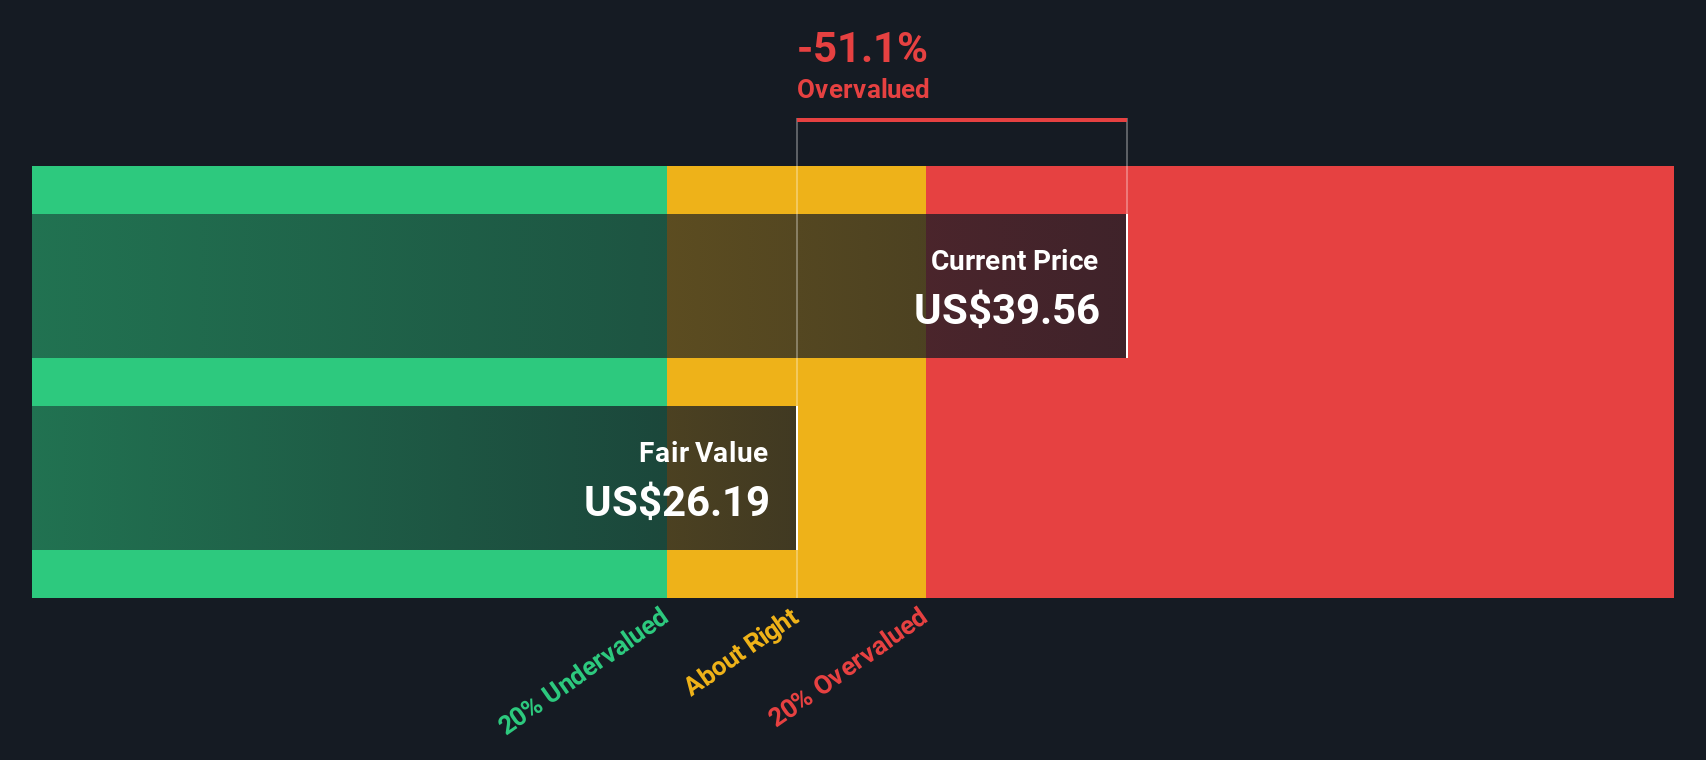
For CenterPoint, the model starts with an annual dividend per share of about $0.97 and assumes a sustainable long term dividend growth rate of 3.26%, capped from a higher raw estimate to stay conservative. With a return on equity of roughly 9.3% and a payout ratio near 55%, the analysis suggests the company can keep raising its dividend without overstretching its balance sheet, provided earnings grow broadly in line with expectations.
Based on these inputs, the DDM points to an intrinsic value of about $26.30 per share. This implies the stock is roughly 42.9% overvalued versus the current price around $37.60. In other words, investors are paying a sizable premium today for what appears to be a steady, but not spectacular, dividend growth profile.
Result: OVERVALUED
Our Dividend Discount Model (DDM) analysis suggests CenterPoint Energy may be overvalued by 42.9%. Discover 913 undervalued stocks or create your own screener to find better value opportunities.
Approach 2: CenterPoint Energy Price vs Earnings
For a profitable utility like CenterPoint, the price to earnings ratio is a straightforward way to judge whether investors are paying too much for each dollar of earnings. In general, faster expected growth and lower perceived risk justify a higher PE, while slower growth or higher risk call for a lower, more cautious multiple.
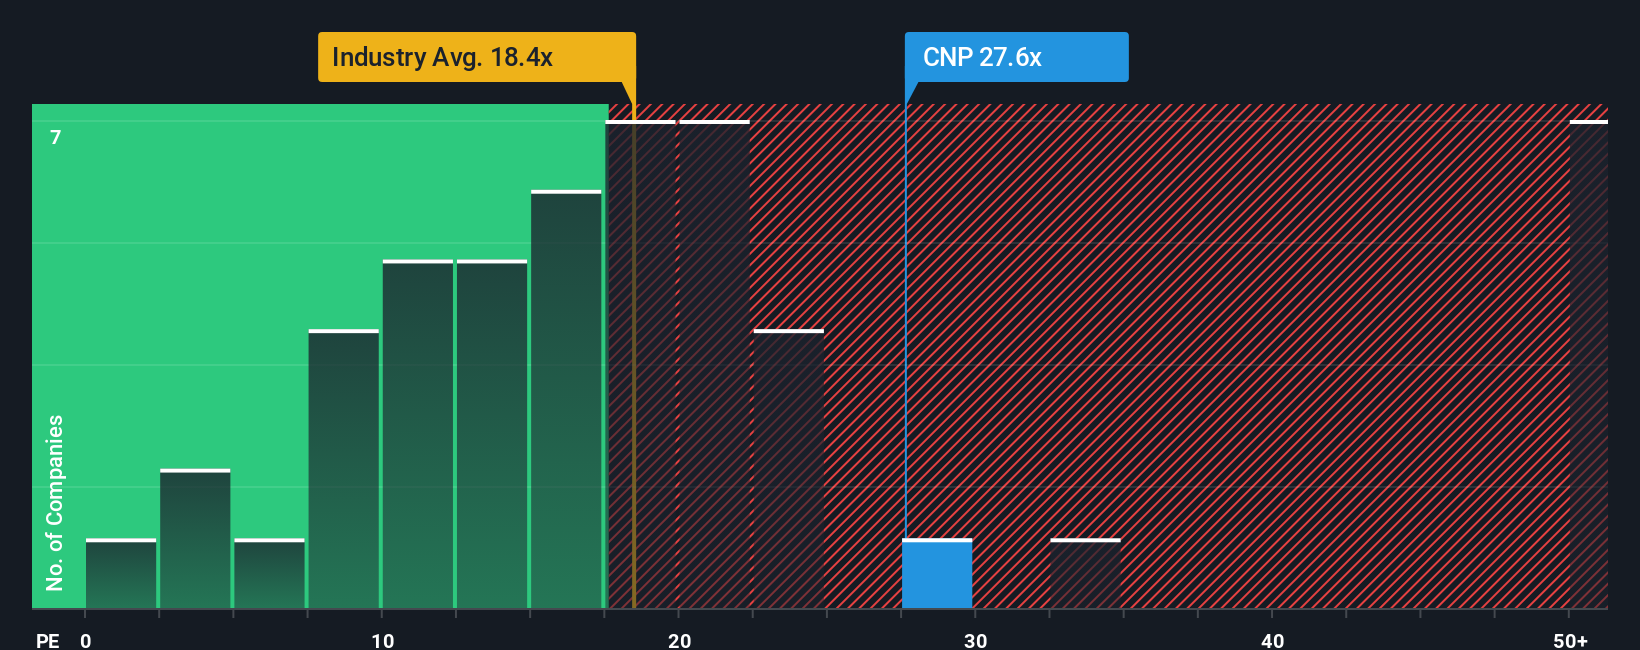
CenterPoint currently trades on a PE of about 23.7x, which is meaningfully above the integrated utilities industry average of roughly 17.9x and also higher than the broader peer group average of around 20.3x. On those simple comparisons, the stock looks expensive. However, Simply Wall St uses a Fair Ratio, a proprietary estimate of what PE a company should trade on given its earnings growth outlook, profitability, risk profile, industry and market cap.
Because the Fair Ratio of 23.6x is tailored to CenterPoint’s specific fundamentals, it offers a more nuanced benchmark than blunt peer or industry averages. With the current PE of 23.7x sitting almost exactly in line with this Fair Ratio, the market appears to be valuing CenterPoint broadly in line with its underlying prospects rather than stretching too far in either direction.
Result: ABOUT RIGHT
PE ratios tell one story, but what if the real opportunity lies elsewhere? Discover 1464 companies where insiders are betting big on explosive growth.
Upgrade Your Decision Making: Choose your CenterPoint Energy Narrative
Earlier we mentioned that there is an even better way to understand valuation. Let us introduce you to Narratives, a simple framework on Simply Wall St’s Community page where you connect your view of a company’s story to a concrete financial forecast and, ultimately, a fair value. You can then compare that to today’s share price to decide whether it looks like a buy or a sell.
Do you think there's more to the story for CenterPoint Energy? Head over to our Community to see what others are saying!

This article by Simply Wall St is general in nature. We provide commentary based on historical data and analyst forecasts only using an unbiased methodology and our articles are not intended to be financial advice. It does not constitute a recommendation to buy or sell any stock, and does not take account of your objectives, or your financial situation. We aim to bring you long-term focused analysis driven by fundamental data. Note that our analysis may not factor in the latest price-sensitive company announcements or qualitative material. Simply Wall St has no position in any stocks mentioned.
Have feedback on this article? Concerned about the content? Get in touch with us directly. Alternatively, email editorial-team@simplywallst.com