
 Nasdaq
 華爾街日報
華爾街日報G-III Apparel (GIII): Valuation Check After Mixed Results, Higher Guidance and New Dividend Program
G-III Apparel Group (GIII) just delivered a mixed update, with softer third quarter sales and earnings but a higher full year profit outlook, and paired it with a new quarterly dividend program.
See our latest analysis for G-III Apparel Group.
The latest pullback, including a 1 day share price return of negative 4.21 percent and weaker quarterly numbers, comes against a backdrop of solid momentum. The 3 month share price return stands at 13.76 percent and the 3 year total shareholder return is 132.44 percent, suggesting longer term investors are still being rewarded even as near term sentiment digests softer sales and the new dividend policy.
If this kind of mixed near term sentiment and longer term upside has you rethinking your watchlist, it could be a good moment to explore fast growing stocks with high insider ownership.
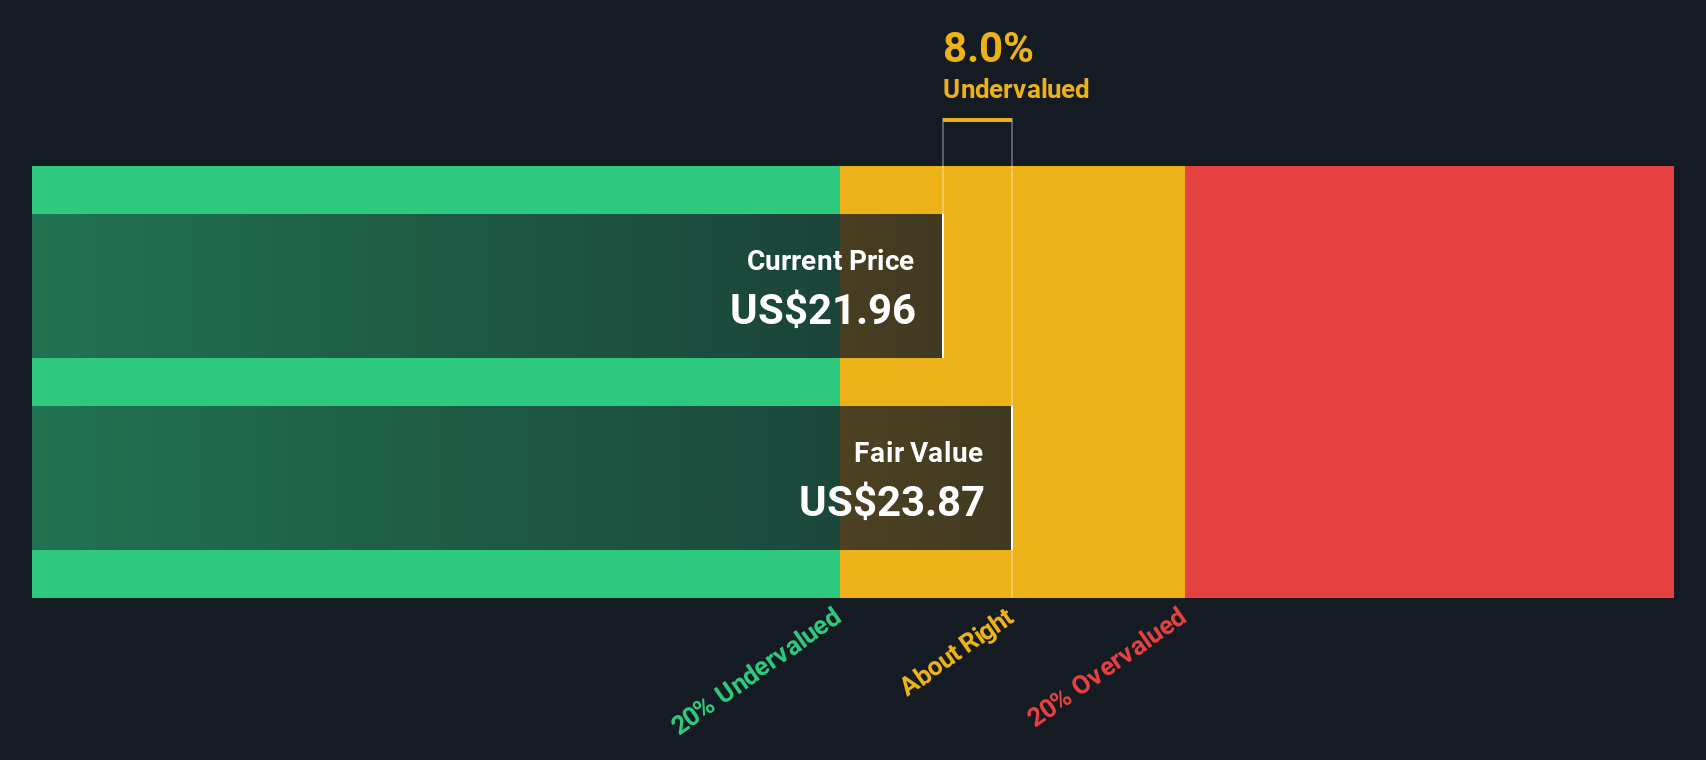
With sales under pressure but profits, buybacks, and a new dividend all pointing to management confidence, is G III Apparel now quietly trading below its true value, or are markets already pricing in the next leg of growth?
Price-to-Earnings of 8.6x: Is it justified?
On a last close of $30.26, G III Apparel trades at a price to earnings ratio of 8.6x, which screens as inexpensive beside both peers and the broader US market.
The price to earnings multiple compares what investors are paying today to the company’s current earnings power, a key lens for mature, consistently profitable apparel groups like G III. With earnings growth having been negative over the last year but solid over five years, this low multiple suggests the market is hesitant to pay up for the current profit run rate.
Against direct peers, the gap is striking. G III’s 8.6x price to earnings sits far below the peer average of 38x and also under the US Luxury industry average of 20.2x, implying investors assign a heavy discount to its earnings despite high quality profits and a long established brand portfolio.
See what the numbers say about this price — find out in our valuation breakdown.
Result: Price-to-Earnings of 8.6x (UNDERVALUED)
However, softening annual revenue growth and a modest intrinsic premium suggest earnings could stall if discretionary demand weakens or brand momentum fades.
Find out about the key risks to this G-III Apparel Group narrative.
Another View: SWS DCF Model Flags Overvaluation
While the low 8.6x earnings multiple suggests G III Apparel is cheap, our DCF model paints a cooler picture. With an estimated fair value of $19.04 versus a $30.26 share price, the stock screens as overvalued. This raises the question of whether earnings can really support today’s optimism.
Look into how the SWS DCF model arrives at its fair value.
Simply Wall St performs a discounted cash flow (DCF) on every stock in the world every day (check out G-III Apparel Group for example). We show the entire calculation in full. You can track the result in your watchlist or portfolio and be alerted when this changes, or use our stock screener to discover 912 undervalued stocks based on their cash flows. If you save a screener we even alert you when new companies match - so you never miss a potential opportunity.
Build Your Own G-III Apparel Group Narrative
If you see the numbers differently or want to stress test your own assumptions, you can build a personalized view in just minutes: Do it your way.
A great starting point for your G-III Apparel Group research is our analysis highlighting 1 key reward and 1 important warning sign that could impact your investment decision.
Ready for your next investing move?
Before you log off, consider using our smartest screeners to look for fresh opportunities, so potential winners are less likely to slip past you.
- Look for early stage growth stories by targeting these 3630 penny stocks with strong financials that already demonstrate real financial strength.
- Explore the AI theme by focusing on these 24 AI penny stocks that may benefit as intelligent software is adopted across major industries.
- Evaluate potential bargains by examining these 912 undervalued stocks based on cash flows that the market may not have fully recognized yet.
This article by Simply Wall St is general in nature. We provide commentary based on historical data and analyst forecasts only using an unbiased methodology and our articles are not intended to be financial advice. It does not constitute a recommendation to buy or sell any stock, and does not take account of your objectives, or your financial situation. We aim to bring you long-term focused analysis driven by fundamental data. Note that our analysis may not factor in the latest price-sensitive company announcements or qualitative material. Simply Wall St has no position in any stocks mentioned.
Have feedback on this article? Concerned about the content? Get in touch with us directly. Alternatively, email editorial-team@simplywallst.com