
 Nasdaq
 華爾街日報
華爾街日報Has MGIC Investment’s Strong Multi Year Rally Already Priced In Its Earnings Power?
- If you are wondering whether MGIC Investment is still a smart buy after such a strong run, or if the easy money has already been made, you are in the right place.
- The stock has climbed 2.1% over the last week, 4.7% over the past month, and is now up 25.2% year to date and 27.9% over the last year, with a striking 145.8% gain over three years and 170.5% over five.
- Behind these moves, investors have largely been reacting to a steadier backdrop for US housing and credit quality, along with more constructive sentiment toward mortgage insurers in general. MGIC has also been benefiting from a perception that its balance sheet strength and capital returns could support the stock if the macro picture turns choppy.
- Based on our checks, MGIC scores a solid 5 out of 6 for valuation, suggesting it still looks undervalued on most metrics. Next, we will unpack how different valuation approaches line up on MGIC, before finishing with a more holistic way to think about its true worth.
Approach 1: MGIC Investment Excess Returns Analysis
The Excess Returns model looks at how much profit MGIC generates above the return that shareholders reasonably demand, and then projects how long that value creation can continue. Instead of focusing on cash flows, it centers on the company’s return on equity and the growth of its book value per share.
MGIC currently has an estimated Book Value of $22.87 per share and a Stable EPS of $3.52 per share, based on weighted future Return on Equity estimates from 4 analysts. With an Average Return on Equity of 13.53% and a Cost of Equity of $1.96 per share, the model calculates an Excess Return of $1.56 per share, indicating MGIC is generating meaningful value above its equity cost. Analysts also project a Stable Book Value of about $26.00 per share from 3 analyst estimates.
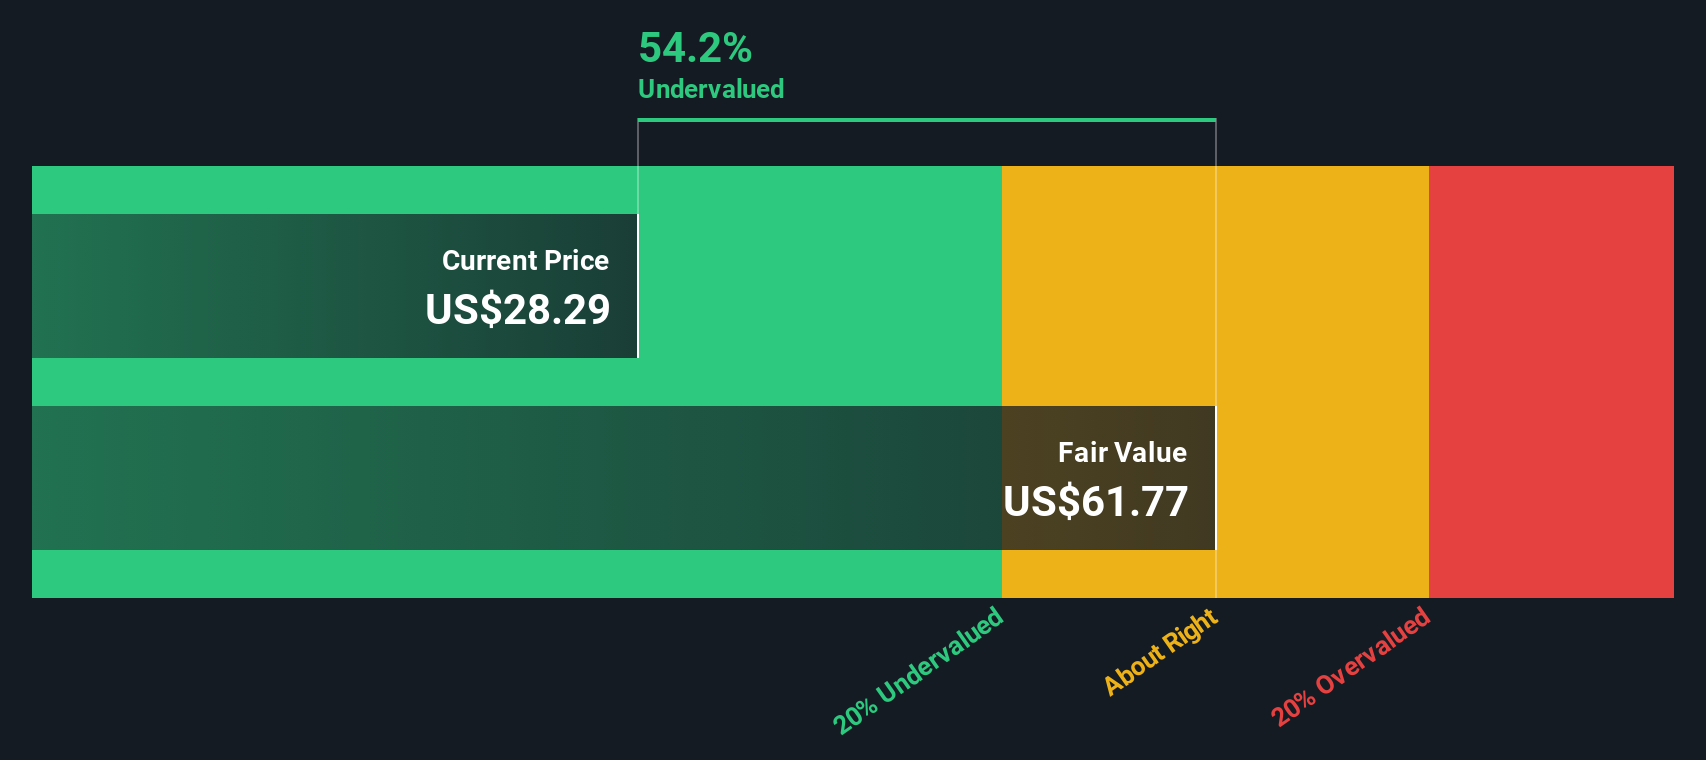
When these excess returns are capitalized, the model points to an intrinsic value of roughly $62.64 per share, implying the stock is about 52.7% undervalued relative to its current price. In plain language, investors are not fully pricing in MGIC’s ongoing value creation.
Result: UNDERVALUED
Our Excess Returns analysis suggests MGIC Investment is undervalued by 52.7%. Track this in your watchlist or portfolio, or discover 912 more undervalued stocks based on cash flows.
Approach 2: MGIC Investment Price vs Earnings
For a consistently profitable company like MGIC, the price to earnings (PE) ratio is a useful way to judge whether investors are paying a reasonable price for each dollar of earnings. PE ratios tend to be higher when the market expects stronger, more reliable growth, and lower when earnings are seen as cyclical or riskier. What counts as a normal or fair PE always depends on both growth prospects and risk.
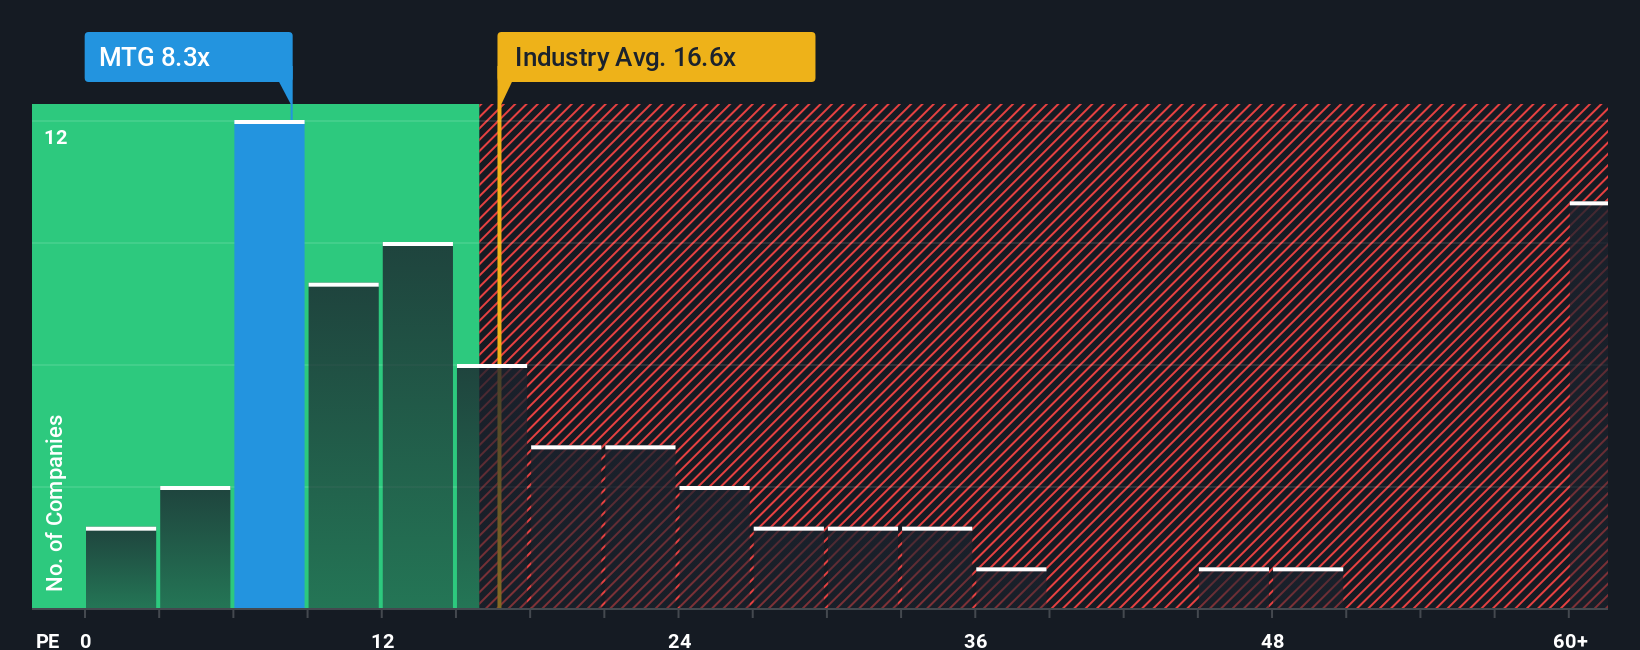
MGIC currently trades on a PE of about 8.8x, which is below both the Diversified Financial industry average of roughly 13.8x and the peer group average of around 10.2x. On the surface, that discount suggests the market is still pricing in more risk or slower growth than for typical peers.
Simply Wall St’s Fair Ratio framework goes a step further by estimating what PE MGIC should trade on given its specific earnings growth outlook, profitability, risk profile, size, and industry. For MGIC, this Fair Ratio is 11.7x, notably above today’s 8.8x. Because this approach adjusts for company specific factors instead of relying on blunt peer or industry comparisons, it offers a more tailored view of value. On that basis MGIC still appears attractively priced.
Result: UNDERVALUED
PE ratios tell one story, but what if the real opportunity lies elsewhere? Discover 1463 companies where insiders are betting big on explosive growth.
Upgrade Your Decision Making: Choose your MGIC Investment Narrative
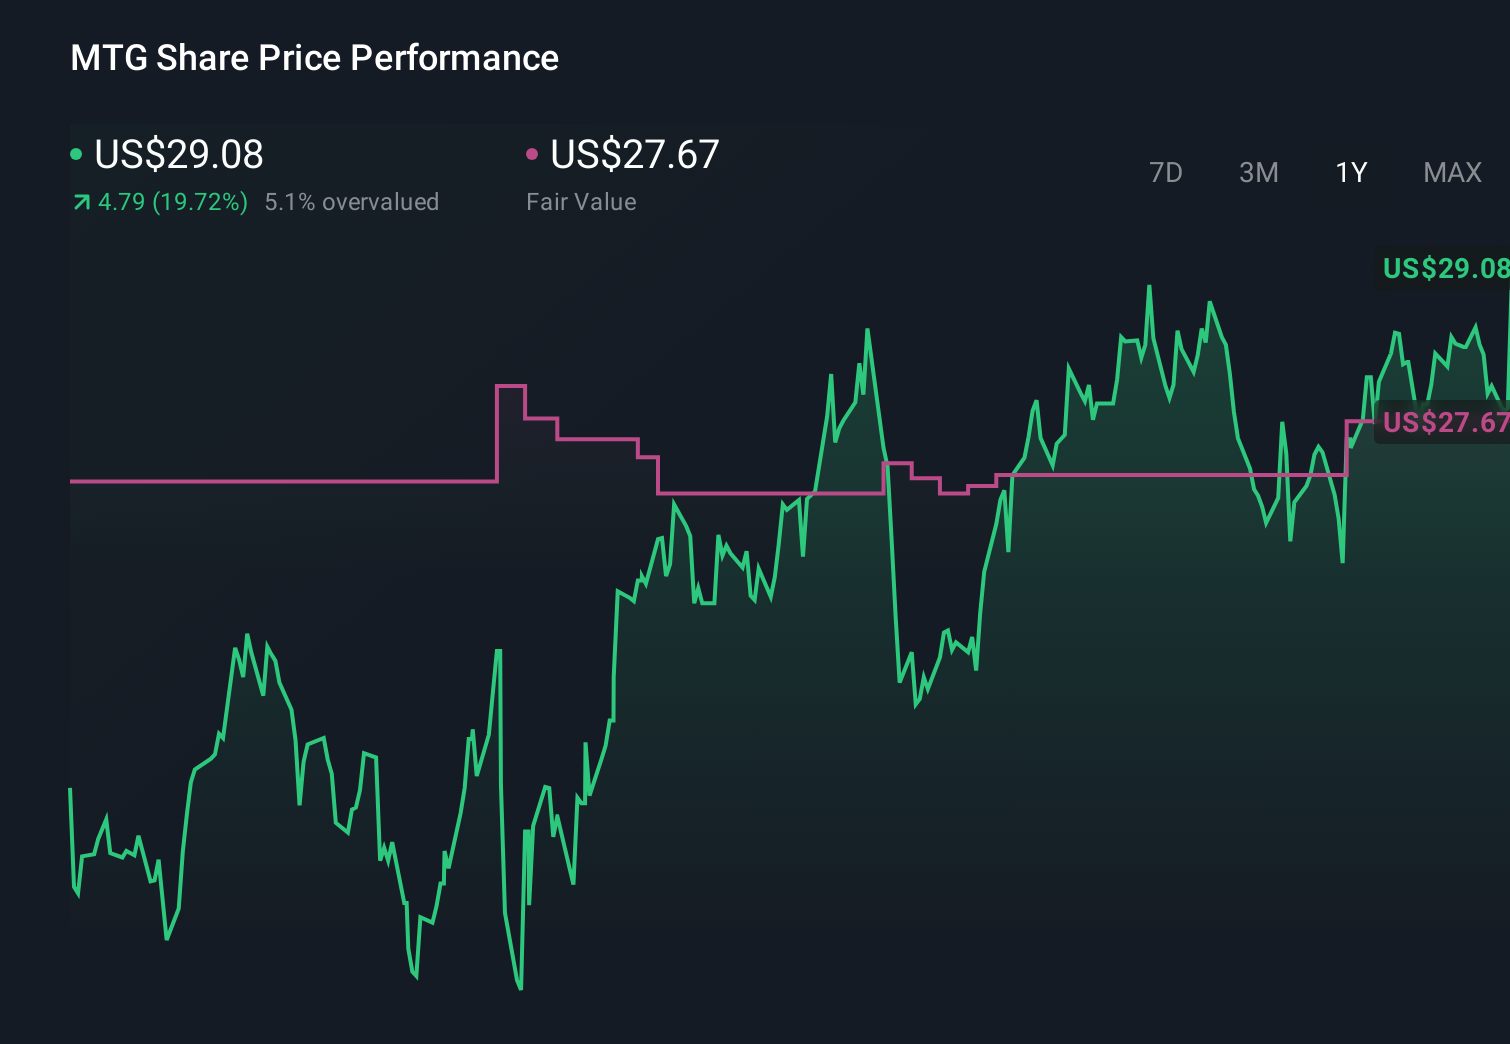
Earlier we mentioned that there is an even better way to understand valuation, so let us introduce Narratives. This is a simple idea where you describe the story you believe about MGIC’s future, link that story to specific forecasts for revenue, earnings and margins, and then see what fair value those assumptions imply. You can do this using an easy tool on Simply Wall St’s Community page that millions of investors already use to compare their own Fair Value against today’s Price, get dynamic updates as new earnings or news emerges, and understand how two investors can look at the same stock yet reach different, but equally structured conclusions. For example, one MGIC Narrative might assume stronger long term housing demand, resilient credit quality, a near 3 percent annual revenue growth rate and a higher forward PE near 9.5x to support a fair value close to $27.67. A more cautious Narrative could lean on slower growth, rising delinquencies, pressure on margins toward the high 40s and a lower multiple, landing closer to the $27.33 analyst target and implying there is limited upside at current prices.
Do you think there's more to the story for MGIC Investment? Head over to our Community to see what others are saying!
This article by Simply Wall St is general in nature. We provide commentary based on historical data and analyst forecasts only using an unbiased methodology and our articles are not intended to be financial advice. It does not constitute a recommendation to buy or sell any stock, and does not take account of your objectives, or your financial situation. We aim to bring you long-term focused analysis driven by fundamental data. Note that our analysis may not factor in the latest price-sensitive company announcements or qualitative material. Simply Wall St has no position in any stocks mentioned.
Have feedback on this article? Concerned about the content? Get in touch with us directly. Alternatively, email editorial-team@simplywallst.com