
 Nasdaq
 華爾街日報
華爾街日報Is Asahi Group Holdings Attractively Priced After Recent Share Price Weakness?
- Wondering if Asahi Group Holdings is quietly turning into a value opportunity while everyone is distracted by flashier names? In this overview, we walk through what the market is pricing in and what the fundamentals suggest it might actually be worth.
- The stock has slipped about 7% over the last week and 6% over the past month, even though it is still up around 1.9% year to date and 1.6% over the last year, with a stronger 27.9% three year and 29.5% five year performance in the background.
- Recently, investors have been reacting to strategic moves such as portfolio optimization in its beverage and beer segments and continued international expansion. These developments help frame expectations for future cash flows. At the same time, broader market rotation between defensive consumer staples and growth names has added some extra volatility to Asahi's share price.
- Against that backdrop, Asahi currently scores a 6/6 valuation check score, suggesting the shares screen as undervalued across multiple metrics. Below, we break down what that means using different valuation approaches before finishing with a more holistic way to think about its true worth.
Find out why Asahi Group Holdings's 1.6% return over the last year is lagging behind its peers.
Approach 1: Asahi Group Holdings Discounted Cash Flow (DCF) Analysis
A Discounted Cash Flow model estimates what a company is worth by projecting the cash it can generate in the future and discounting those cash flows back into today’s yen value. For Asahi Group Holdings, the model uses a 2 Stage Free Cash Flow to Equity approach, starting from last twelve month free cash flow of about ¥172.7 billion and then layering in analyst forecasts and longer term extrapolations.
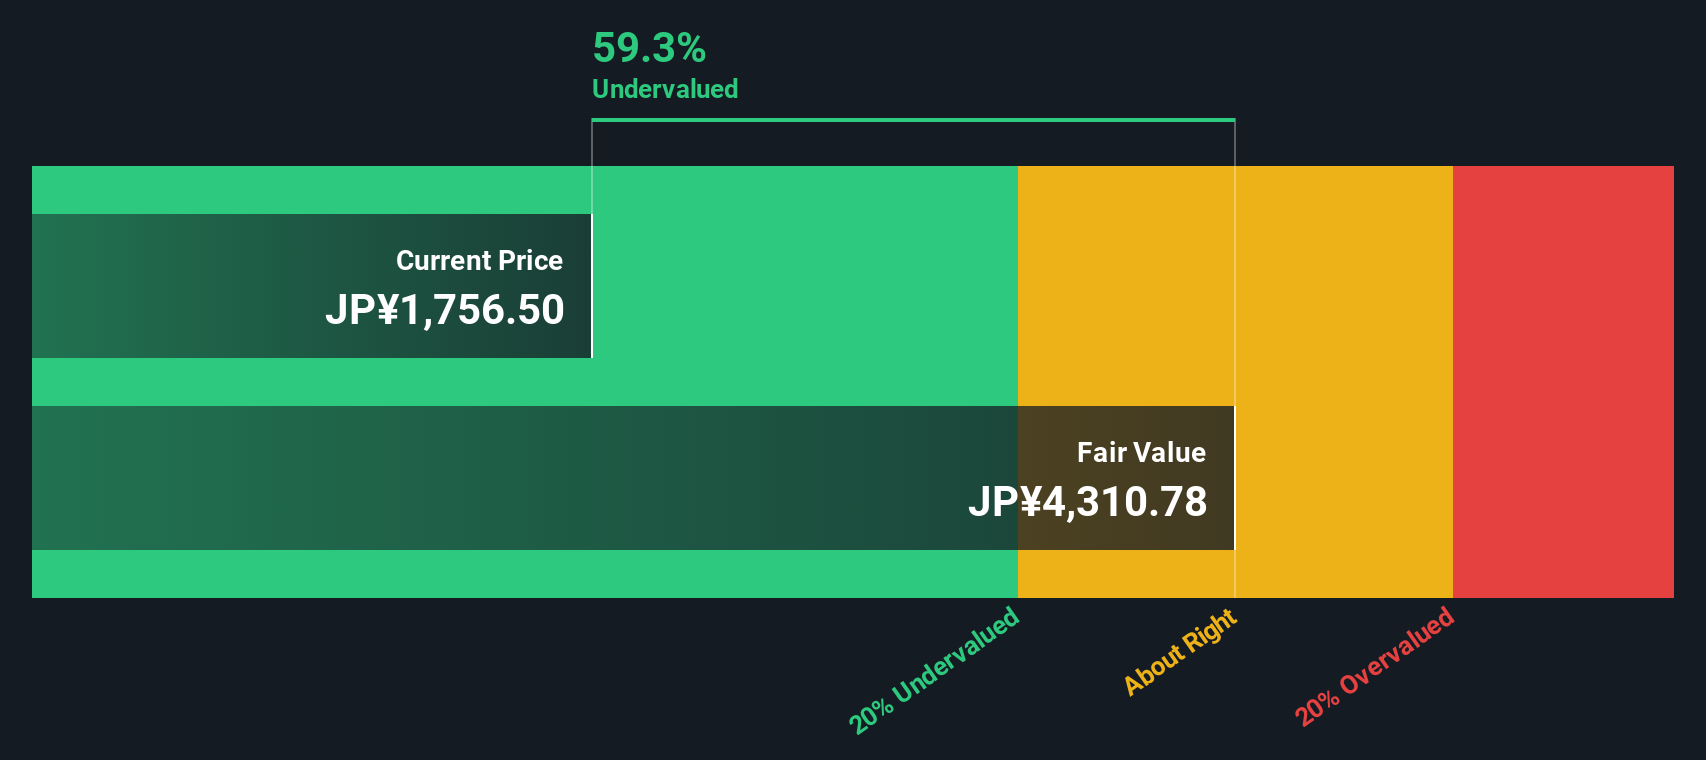
Analysts see free cash flow rising to roughly ¥270.5 billion by 2029, with further gradual growth thereafter based on Simply Wall St estimates. These future cash flows, all in ¥, are discounted back to today to arrive at an intrinsic value of about ¥4,654 per share. When this is compared with the current share price, the DCF implies Asahi is trading at roughly a 64.8% discount to its estimated fair value. This suggests the market is pricing in a far weaker cash flow trajectory than the model assumes.
Result: UNDERVALUED
Our Discounted Cash Flow (DCF) analysis suggests Asahi Group Holdings is undervalued by 64.8%. Track this in your watchlist or portfolio, or discover 912 more undervalued stocks based on cash flows.
Approach 2: Asahi Group Holdings Price vs Earnings
For profitable, established businesses like Asahi, the price to earnings ratio is a practical way to gauge value because it directly links what investors pay today with the profits the company is generating right now. In general, faster growing, higher quality and lower risk companies tend to have a higher PE, while slower growth or higher uncertainty is often reflected in a lower, more cautious multiple.
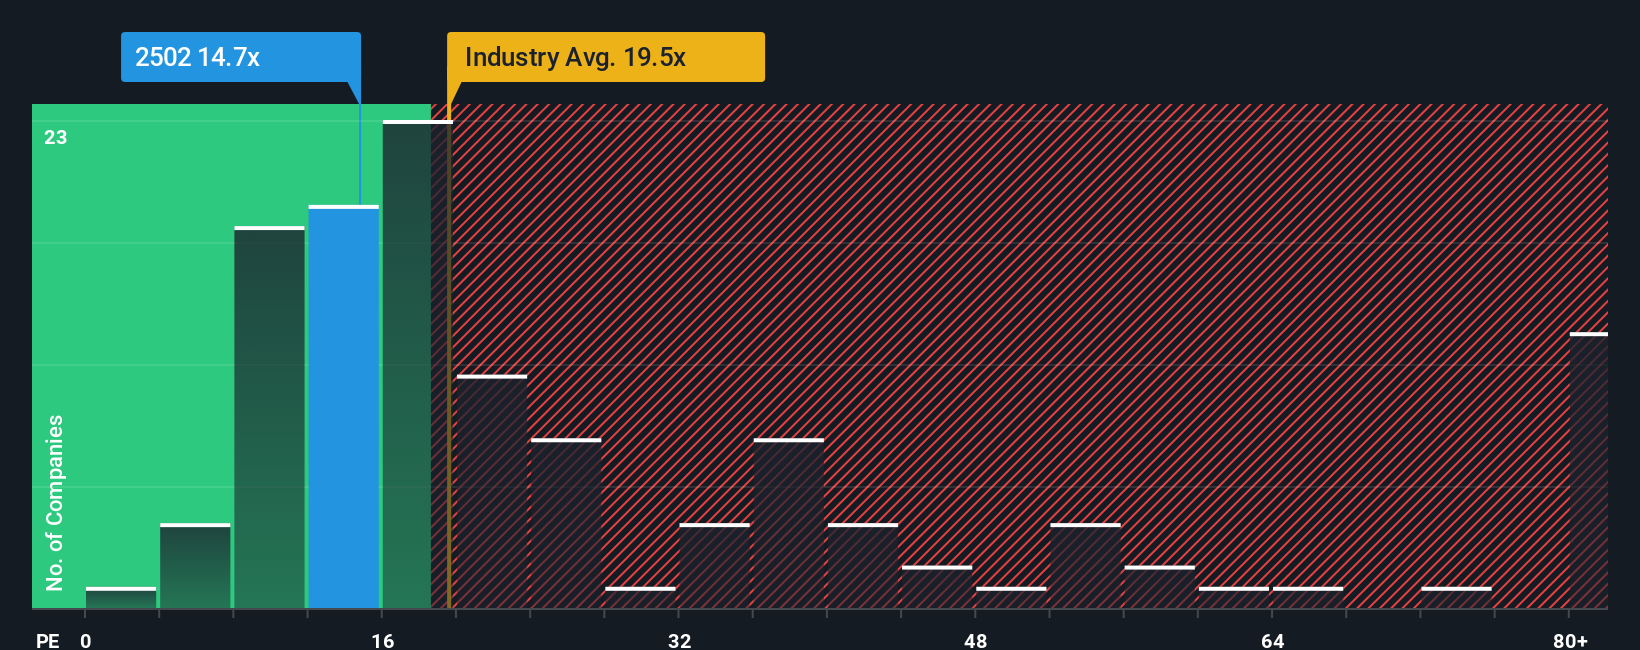
Asahi currently trades on about 13.8x earnings, which is below both the Beverage industry average of roughly 17.7x and a much higher peer average of around 34.4x. To go beyond these broad comparisons, Simply Wall St uses a Fair Ratio, a proprietary estimate of what PE the market might reasonably pay given Asahi’s growth outlook, margins, size, sector and risk profile. This makes it more tailored than a simple industry or peer comparison, which can be skewed by very different business models or growth rates.
For Asahi, the Fair Ratio is estimated at about 24.2x, compared with the current 13.8x. That spread points to the shares trading at a material discount on an earnings basis.
Result: UNDERVALUED
PE ratios tell one story, but what if the real opportunity lies elsewhere? Discover 1463 companies where insiders are betting big on explosive growth.
Upgrade Your Decision Making: Choose your Asahi Group Holdings Narrative
Earlier we mentioned that there is an even better way to understand valuation, so let us introduce you to Narratives, a simple way to combine your view of Asahi Group Holdings with the numbers behind it. A Narrative is your story about the company, translated into assumptions for future revenue, earnings and margins, which then feeds into a forecast and a fair value estimate. Instead of looking at raw metrics in isolation, Narratives connect what you believe about Asahi’s strategy and competitive position with a structured financial model and a clear fair value that you can compare to today’s share price to decide whether to buy, hold or sell. On Simply Wall St, millions of investors explore and build Narratives on the Community page, where these views are continuously refreshed as new news, earnings or guidance are released, updating the underlying forecasts and fair value automatically. For Asahi, for example, one Narrative might assume robust international expansion and a higher margin profile, while another could bake in slower growth and more muted profitability, leading to very different fair value estimates and, therefore, different investment decisions.
Do you think there's more to the story for Asahi Group Holdings? Head over to our Community to see what others are saying!

This article by Simply Wall St is general in nature. We provide commentary based on historical data and analyst forecasts only using an unbiased methodology and our articles are not intended to be financial advice. It does not constitute a recommendation to buy or sell any stock, and does not take account of your objectives, or your financial situation. We aim to bring you long-term focused analysis driven by fundamental data. Note that our analysis may not factor in the latest price-sensitive company announcements or qualitative material. Simply Wall St has no position in any stocks mentioned.
Have feedback on this article? Concerned about the content? Get in touch with us directly. Alternatively, email editorial-team@simplywallst.com