
 Nasdaq
 華爾街日報
華爾街日報Is A. O. Smith Attractively Priced After Expansion In Water Treatment And Efficiency Offerings?
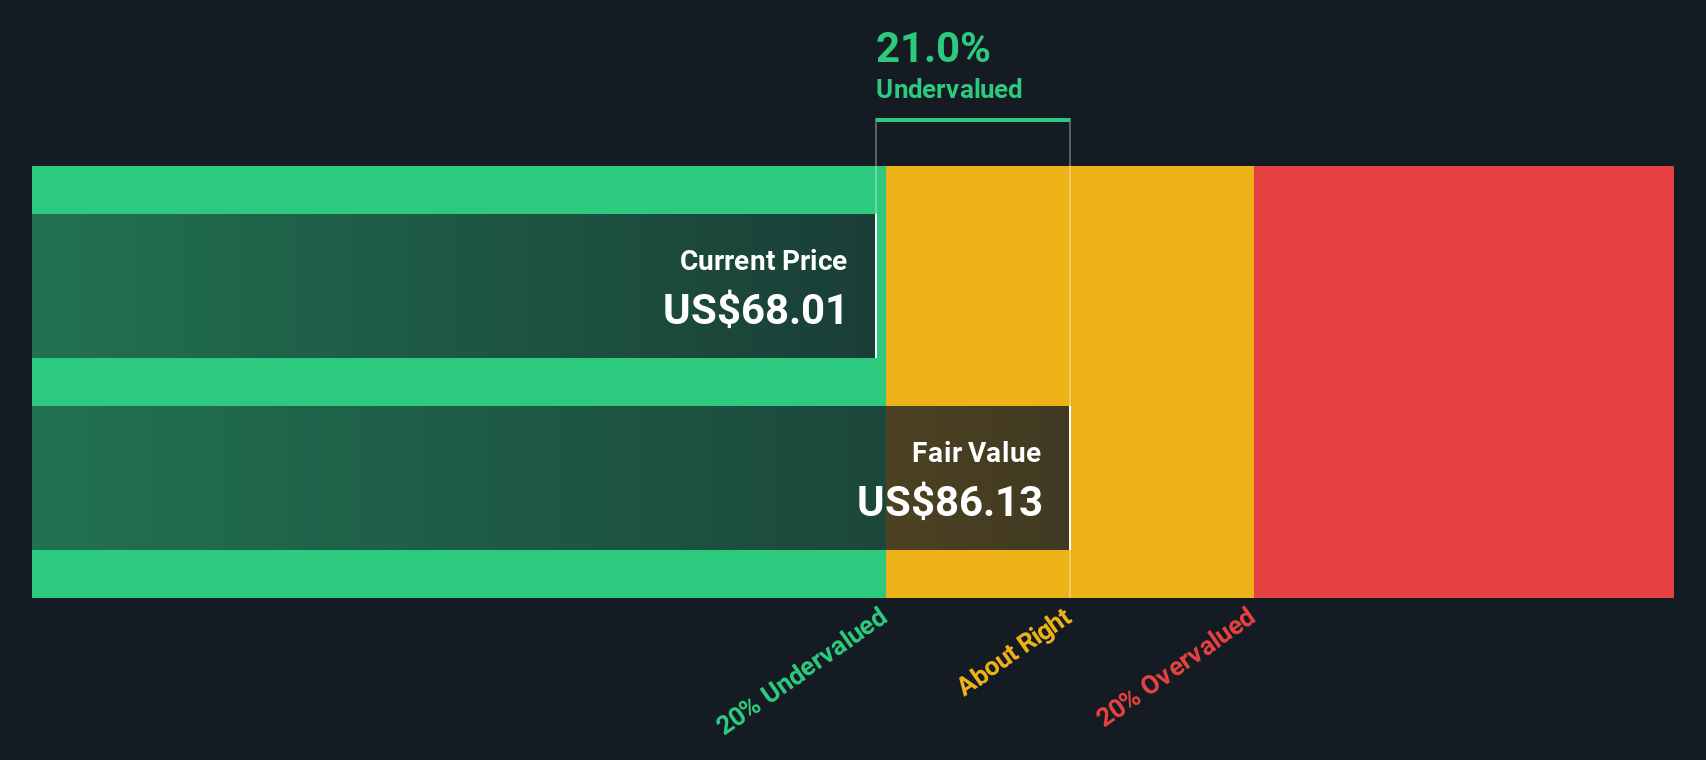
- Wondering if A. O. Smith at around $68 a share is quietly undervalued or just fairly priced? You are not alone, and that is exactly what we are going to unpack here.
- Despite only a 1.0% return over the last year, the stock has climbed 6.9% in the past month after a softer 1.0% dip over the last week, hinting that sentiment may be shifting again.
- Recent headlines have focused on A. O. Smith expanding its water treatment and high efficiency water heating offerings, plus ongoing investment in innovation and international markets, signaling that management is still leaning into long term growth themes. At the same time, macro chatter around housing, infrastructure spending, and energy efficiency incentives has given investors fresh reasons to revisit companies tied to residential and commercial water systems.
- On our checks, A. O. Smith scores a solid 5 out of 6 on valuation, suggesting it looks undervalued on most of the metrics we track. Next we will break down those different valuation lenses before exploring an even better way to think about what the stock is really worth.
Approach 1: A. O. Smith Discounted Cash Flow (DCF) Analysis
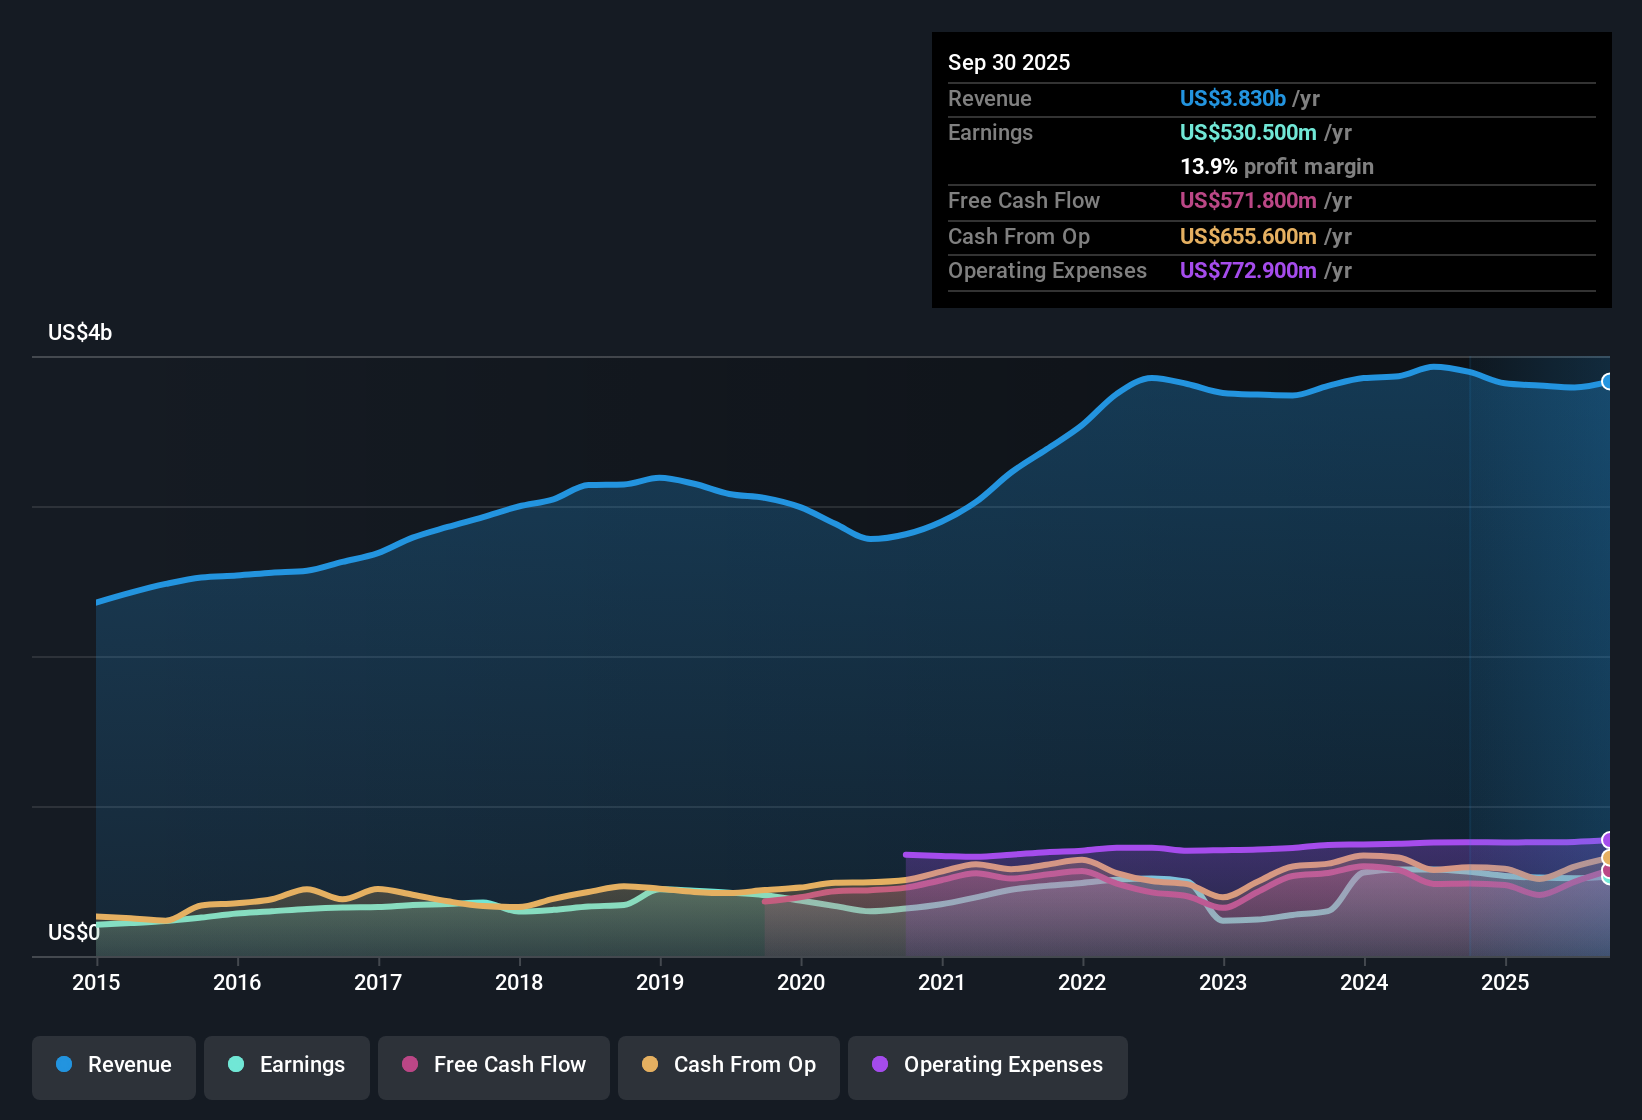
A Discounted Cash Flow model estimates what a business is worth by projecting the cash it can generate in the future, then discounting those cash flows back into today’s dollars. For A. O. Smith, the latest twelve month free cash flow sits at about $571 million, providing a solid base for forecasting.
Analysts and extrapolated estimates used in this 2 Stage Free Cash Flow to Equity model see free cash flow rising gradually over time, reaching roughly $829 million by 2035. Simply Wall St uses direct analyst forecasts for the earlier years, then tapers growth assumptions beyond that period to keep long term expectations realistic.
Rolling all of those projected cash flows together and discounting them back gives an estimated intrinsic value of about $86.19 per share, in dollar terms. Compared with the current share price around $68, the model implies the stock is trading at roughly a 21.1% discount and appears undervalued based on this cash flow model.
Result: UNDERVALUED
Our Discounted Cash Flow (DCF) analysis suggests A. O. Smith is undervalued by 21.1%. Track this in your watchlist or portfolio, or discover 910 more undervalued stocks based on cash flows.
Approach 2: A. O. Smith Price vs Earnings
For profitable companies like A. O. Smith, the price to earnings, or PE, ratio is a useful shorthand for how much investors are willing to pay today for each dollar of current earnings. It reflects not just what the business is earning now, but also how the market feels about its future growth and the risks around those earnings.
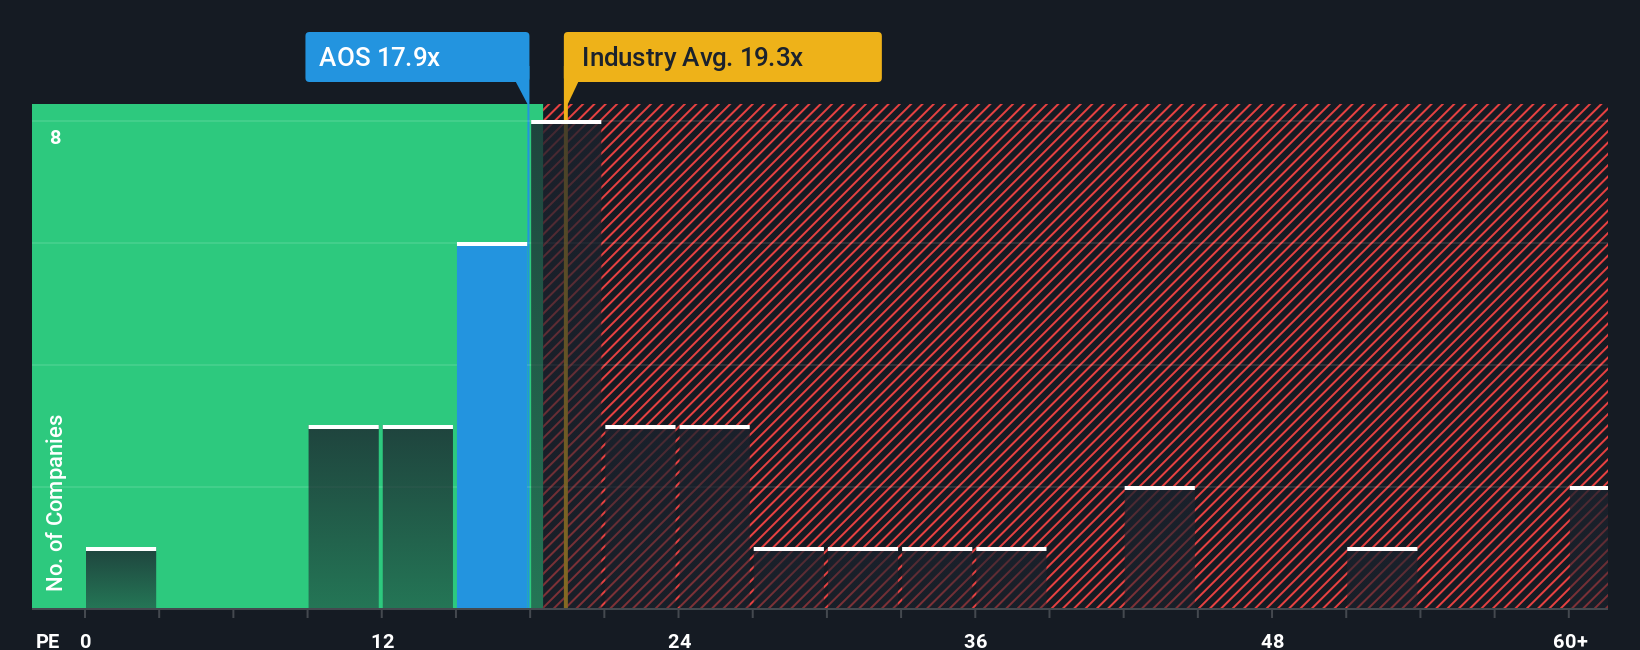
Higher growth and lower perceived risk usually justify a higher, or more expensive, PE, while slower or more volatile businesses tend to trade on lower multiples. A. O. Smith currently trades on about 17.9x earnings, which is below both the broader Building industry average of roughly 19.3x and the peer group average near 31.6x, suggesting the market is assigning it a relative discount.
Simply Wall St uses a Fair Ratio framework to estimate what a more tailored PE should be for A. O. Smith, based on its specific earnings growth profile, margins, risk factors, industry positioning and market cap. That Fair Ratio comes out at about 20.0x, notably above the current 17.9x. This suggests the stock is trading below what its fundamentals would typically warrant and appears modestly undervalued on this earnings multiple lens.
Result: UNDERVALUED
PE ratios tell one story, but what if the real opportunity lies elsewhere? Discover 1462 companies where insiders are betting big on explosive growth.
Upgrade Your Decision Making: Choose your A. O. Smith Narrative
Earlier we mentioned that there is an even better way to understand valuation, so let us introduce you to Narratives, which are simple stories you build about a company that link your view of its future revenue, earnings and margins to a financial forecast and, ultimately, to a fair value estimate. On Simply Wall St’s Community page, millions of investors use Narratives as an easy, guided tool to turn their assumptions into numbers and then compare their Fair Value with today’s market price to decide whether to buy, hold or sell, with each Narrative automatically updating as new information such as earnings or major news arrives. For A. O. Smith, for example, one investor might create a bullish Narrative built around accelerating adoption of smart, energy efficient products, international growth and premium pricing that supports a fair value closer to the optimistic 89 dollar target. A more cautious investor could build a Narrative focused on China slowdown risks, mature North American demand and higher input costs that anchors fair value nearer the 65 dollar bear case.
Do you think there's more to the story for A. O. Smith? Head over to our Community to see what others are saying!
This article by Simply Wall St is general in nature. We provide commentary based on historical data and analyst forecasts only using an unbiased methodology and our articles are not intended to be financial advice. It does not constitute a recommendation to buy or sell any stock, and does not take account of your objectives, or your financial situation. We aim to bring you long-term focused analysis driven by fundamental data. Note that our analysis may not factor in the latest price-sensitive company announcements or qualitative material. Simply Wall St has no position in any stocks mentioned.
Have feedback on this article? Concerned about the content? Get in touch with us directly. Alternatively, email editorial-team@simplywallst.com