
 Nasdaq
 華爾街日報
華爾街日報Is Patterson-UTI Energy Mispriced After 31.7% Drop in 2025 Amid Sector Consolidation?
- If you are wondering whether Patterson-UTI Energy is a bargain or a value trap at today’s price, you are not alone. This breakdown is designed to give you a clear, no-jargon answer.
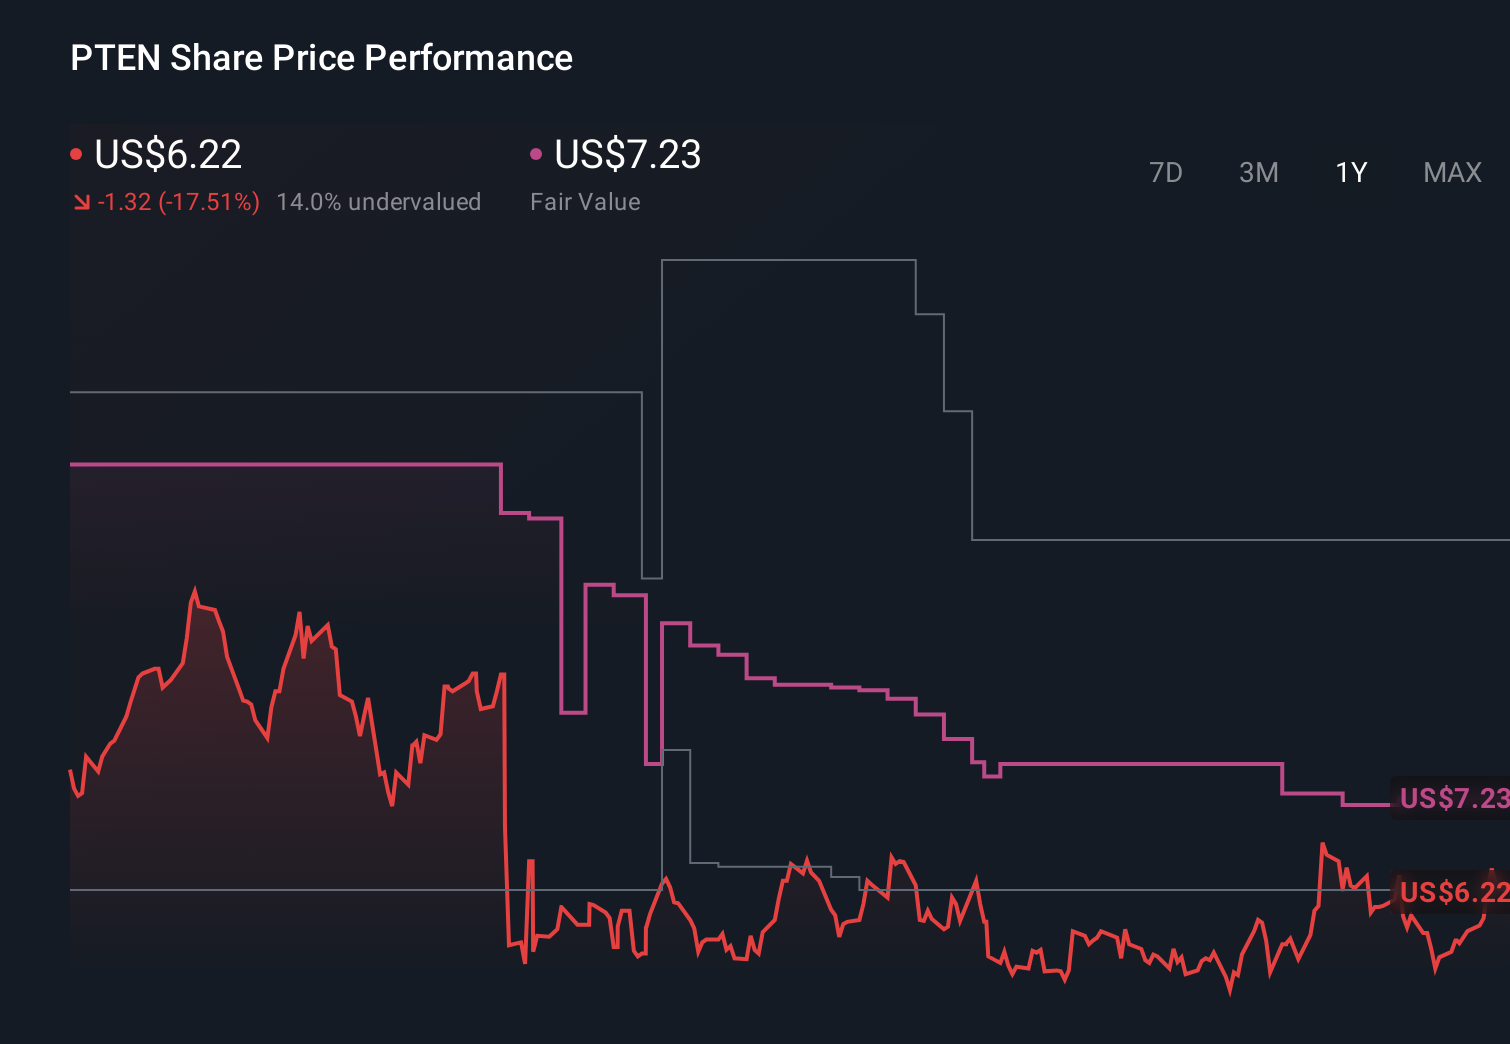
- The stock has slipped 6.1% over the last week and is down 31.7% year to date, yet it is still up 25.6% over five years. This highlights how cyclical this name can be.
- Recent headlines have focused on shifting North American drilling activity and ongoing consolidation in oilfield services, both of which directly influence Patterson-UTI’s contract visibility and pricing power. Investors are also weighing how management’s capital allocation, particularly around fleet upgrades and shareholder returns, might position the company for the next phase of the energy cycle.
- Despite the choppy share price, Patterson-UTI scores a strong 6/6 on our valuation checks. This suggests it screens as undervalued across every metric we use. In the next sections we will unpack those methods and then circle back at the end to a more intuitive way of thinking about what the stock is really worth.
Find out why Patterson-UTI Energy's -20.0% return over the last year is lagging behind its peers.
Approach 1: Patterson-UTI Energy Discounted Cash Flow (DCF) Analysis
A Discounted Cash Flow model estimates what a business is worth by projecting the cash it can generate in the future, then discounting those cash flows back to today to account for risk and the time value of money.
For Patterson-UTI Energy, the latest twelve month Free Cash Flow is about $234.9 million. Analysts forecast this to rise steadily, with Simply Wall St extending their estimates beyond the usual five year window. By 2028, annual Free Cash Flow is projected to reach roughly $383 million, and the longer term extrapolations point to continued growth into the early 2030s as drilling demand and pricing normalize across cycles.
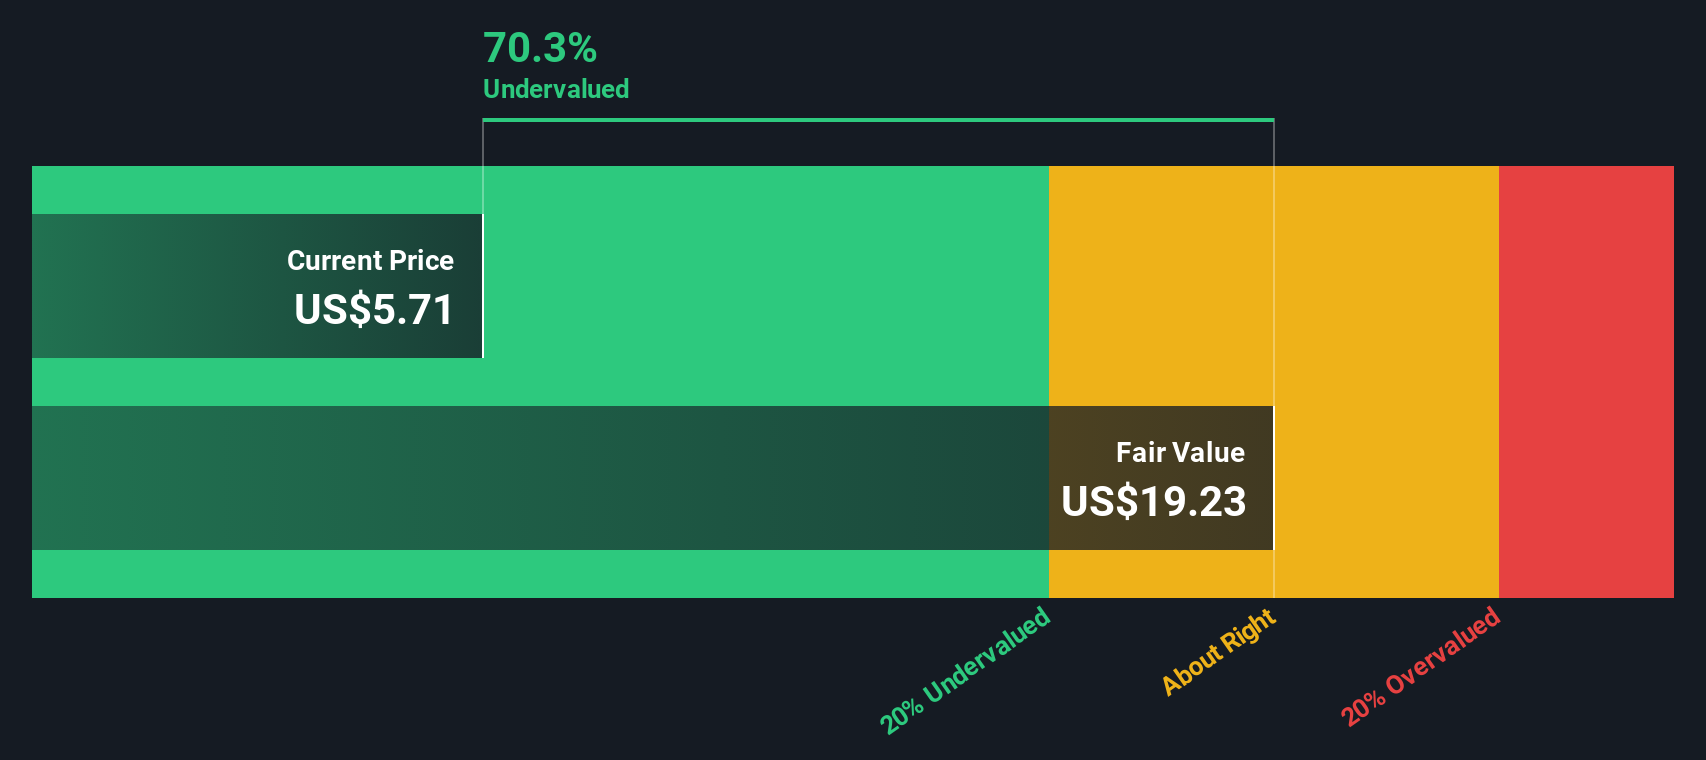
When all those future cash flows are discounted back to today using a 2 Stage Free Cash Flow to Equity model, the intrinsic value comes out at around $24.36 per share. Compared with the current market price, this implies the shares are trading at a 76.1% discount, which indicates the market may be underpricing Patterson-UTI’s long term cash generation.
Result: UNDERVALUED
Our Discounted Cash Flow (DCF) analysis suggests Patterson-UTI Energy is undervalued by 76.1%. Track this in your watchlist or portfolio, or discover 910 more undervalued stocks based on cash flows.
Approach 2: Patterson-UTI Energy Price vs Sales
For a cyclical energy services business like Patterson-UTI, the Price to Sales ratio is a useful yardstick because revenue tends to be more stable across cycles than earnings, which can swing sharply with day rate and utilization changes. In general, the higher the market’s expectations for sustainable growth and the lower the perceived risk, the higher the “normal” or “fair” multiple investors are willing to pay.
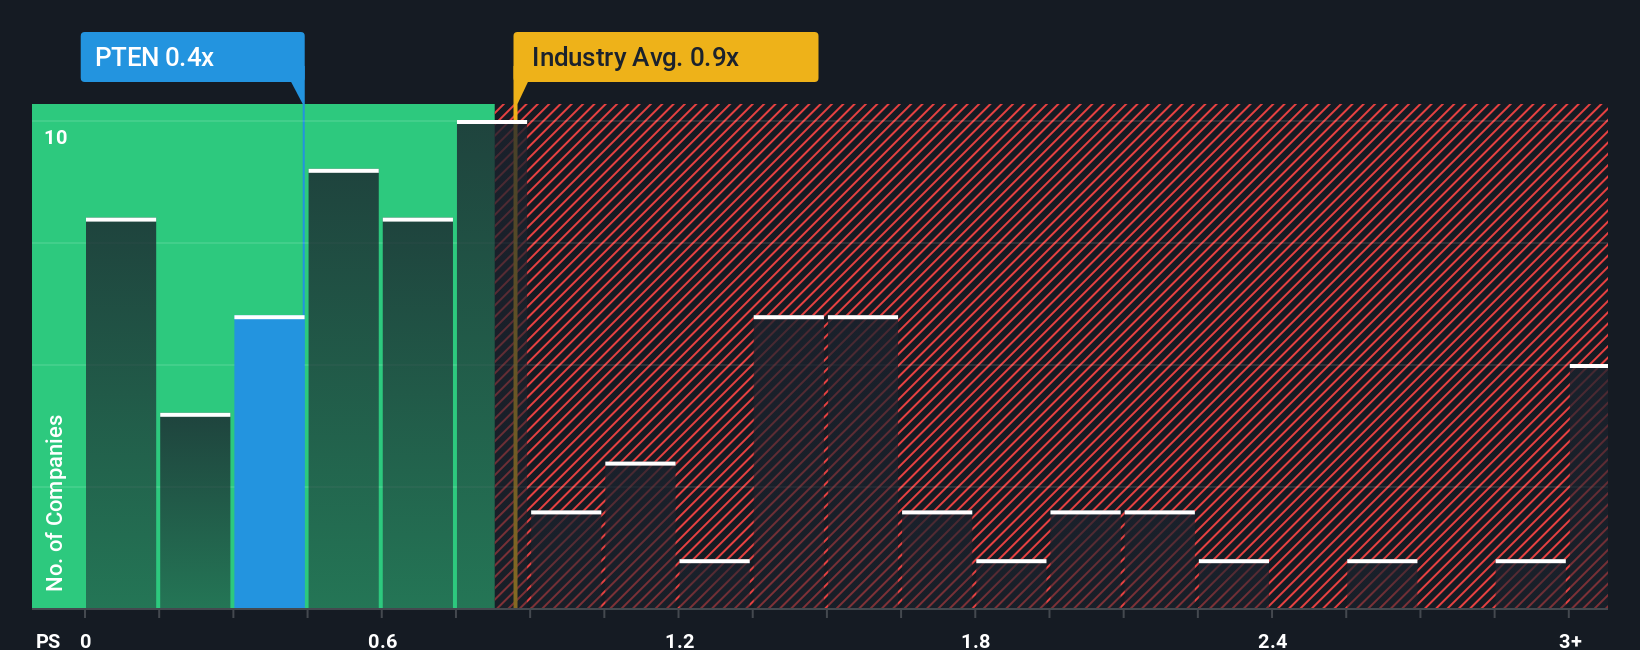
Patterson-UTI currently trades on a Price to Sales ratio of about 0.46x, which is well below both the Energy Services industry average of around 1.13x and the peer group average of roughly 1.21x. Simply Wall St’s proprietary Fair Ratio for Patterson-UTI is 0.63x, which reflects what investors might reasonably pay given its growth prospects, profitability profile, market cap, sector, and risk characteristics.
This Fair Ratio is more informative than a simple comparison with peers or the industry because it adjusts for company specific factors rather than assuming all drillers deserve the same multiple. Comparing the Fair Ratio of 0.63x to the actual 0.46x suggests the market is discounting the stock more than its fundamentals warrant, indicating potential undervaluation on a sales basis.
Result: UNDERVALUED
PS ratios tell one story, but what if the real opportunity lies elsewhere? Discover 1462 companies where insiders are betting big on explosive growth.
Upgrade Your Decision Making: Choose your Patterson-UTI Energy Narrative
Earlier we mentioned that there is an even better way to understand valuation, so let us introduce you to Narratives, which are simply your story about Patterson-UTI Energy tied directly to your assumptions for its future revenue, earnings and margins. These turn those expectations into a forecast and then into a Fair Value that you can easily compare with today’s share price to help you decide how to approach the stock.
On Simply Wall St’s Community page, millions of investors use Narratives as an accessible tool to capture their perspective. Some take a more bullish view that sees premium digital drilling technology, LNG driven gas demand and ongoing share repurchases as supporting a Fair Value closer to the high single digit analyst targets. Others take a more cautious view, focused on activity softness, capital intensity and energy transition risks, which anchors Fair Value nearer the low single digit estimates. Because these Narratives are dynamically updated as new earnings, news and analyst revisions come in, the story and the numbers stay in sync without you needing to rebuild your model from scratch.
Do you think there's more to the story for Patterson-UTI Energy? Head over to our Community to see what others are saying!
This article by Simply Wall St is general in nature. We provide commentary based on historical data and analyst forecasts only using an unbiased methodology and our articles are not intended to be financial advice. It does not constitute a recommendation to buy or sell any stock, and does not take account of your objectives, or your financial situation. We aim to bring you long-term focused analysis driven by fundamental data. Note that our analysis may not factor in the latest price-sensitive company announcements or qualitative material. Simply Wall St has no position in any stocks mentioned.
Have feedback on this article? Concerned about the content? Get in touch with us directly. Alternatively, email editorial-team@simplywallst.com