
 Nasdaq
 華爾街日報
華爾街日報Is CarMax Stock a Value Opportunity After a 52% Slide in 2025?
- Wondering if CarMax is a beaten down bargain or a value trap at current levels? This article will walk you through what the stock price is really implying.
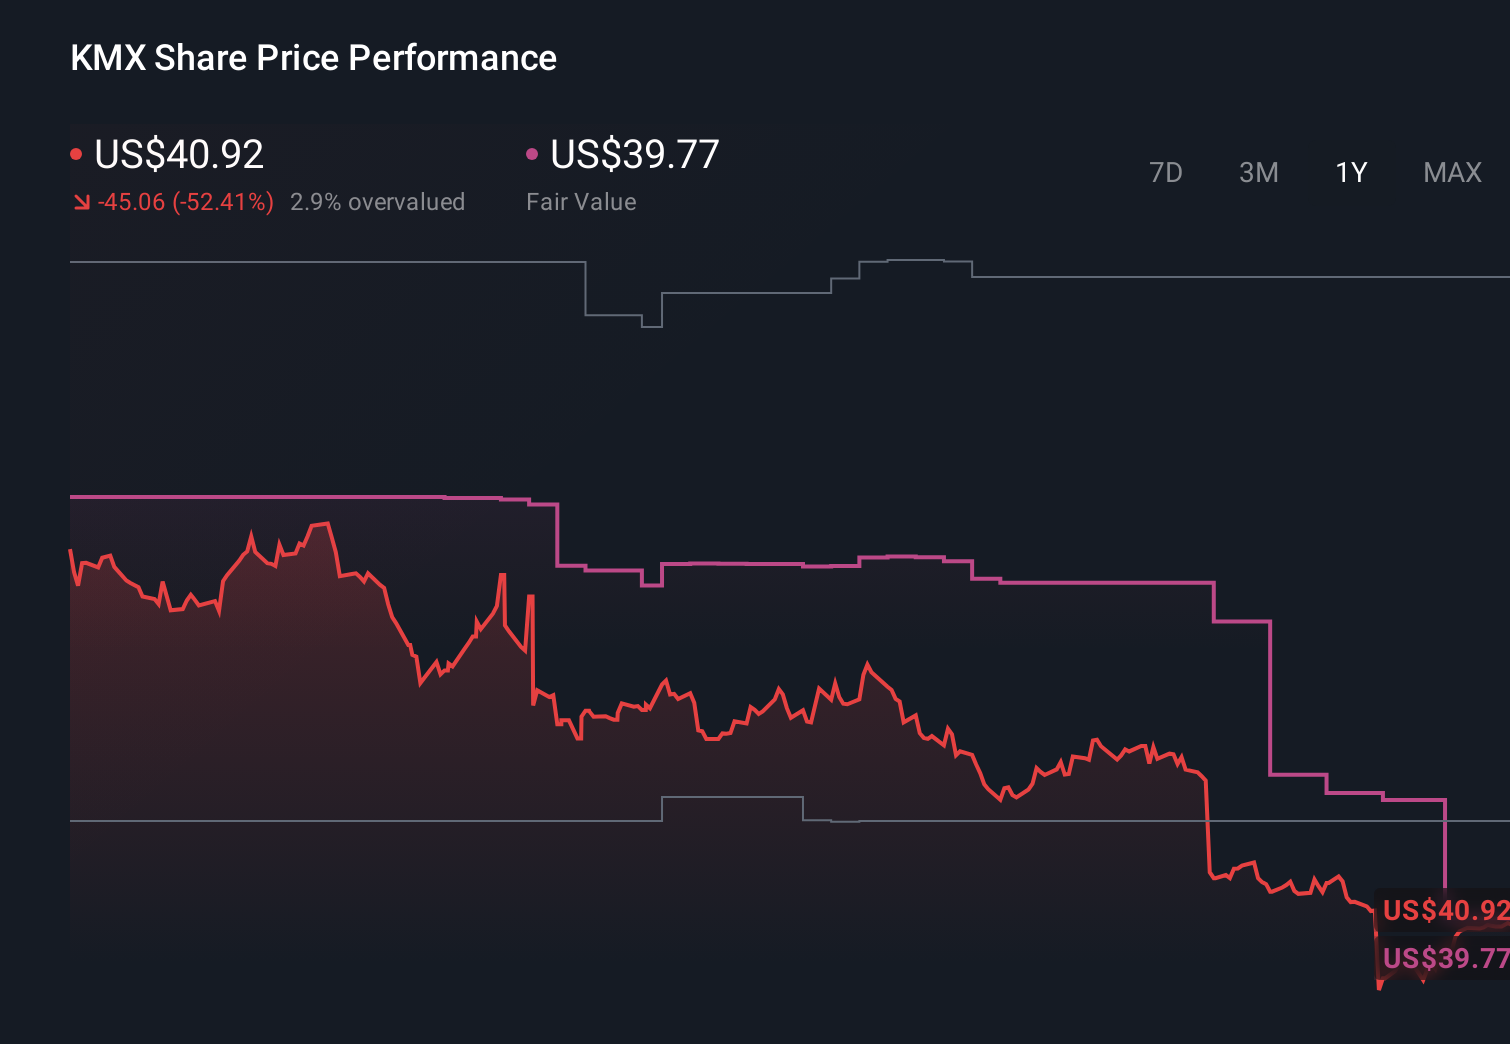
- After sliding 6.2% over the last week, CarMax is still up 12.5% for the past month, yet it remains deeply underwater with a -52.6% year to date return and -54.3% over the last year.
- Those sharp moves have come as investors reassess used car demand, financing costs, and consumer credit conditions, while also watching how CarMax adapts to an increasingly digital retail environment. News around tighter auto lending standards and shifting used vehicle price trends has kept sentiment volatile, which helps explain the stock’s dramatic drawdown.
- Right now, CarMax scores a 4/6 on our valuation checks. This suggests it looks undervalued on several fronts, but not all. Next we will break down what different valuation approaches say about the stock, and later we will look at a more complete way to think about its true worth beyond just the headline multiples.
Find out why CarMax's -54.3% return over the last year is lagging behind its peers.
Approach 1: CarMax Discounted Cash Flow (DCF) Analysis
A Discounted Cash Flow model estimates what a business is worth by projecting the cash it can generate in the future and discounting those cash flows back to today’s value. For CarMax, the model uses a 2 Stage Free Cash Flow to Equity approach.
CarMax has generated trailing twelve month free cash flow of about $2.0 billion. Analysts and extrapolated estimates point to free cash flow of roughly $0.42 billion in 2035, implying more moderate cash generation further out as growth normalizes. These projections, all in $, are discounted back to today using a required return to reflect risk and the time value of money.
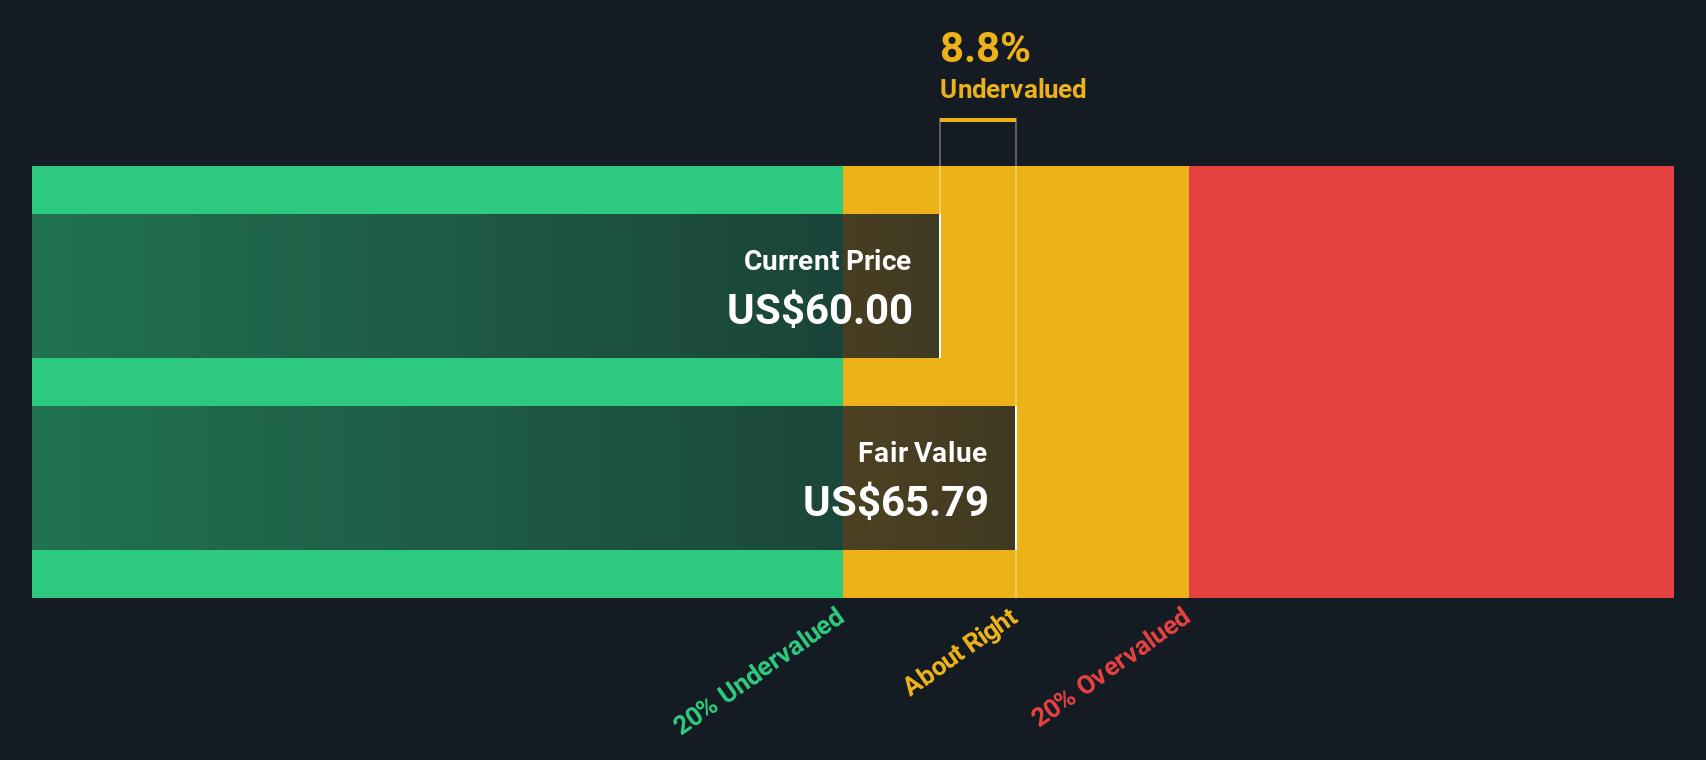
On this basis, the DCF model points to an intrinsic value of about $40.58 per share. Compared with the current share price, this implies the stock trades at roughly a 5.2% discount, which is a modest gap rather than a deep bargain. In other words, the market price and the DCF value are broadly in the same ballpark.
Result: ABOUT RIGHT
CarMax is fairly valued according to our Discounted Cash Flow (DCF), but this can change at a moment's notice. Track the value in your watchlist or portfolio and be alerted on when to act.
Approach 2: CarMax Price vs Earnings
For a profitable business like CarMax, the price to earnings, or PE, ratio is a useful way to gauge how much investors are paying for each dollar of current profit. In general, companies with stronger and more reliable growth are often viewed as deserving a higher PE, while businesses facing slower growth or higher risk tend to trade on lower multiples to compensate investors.
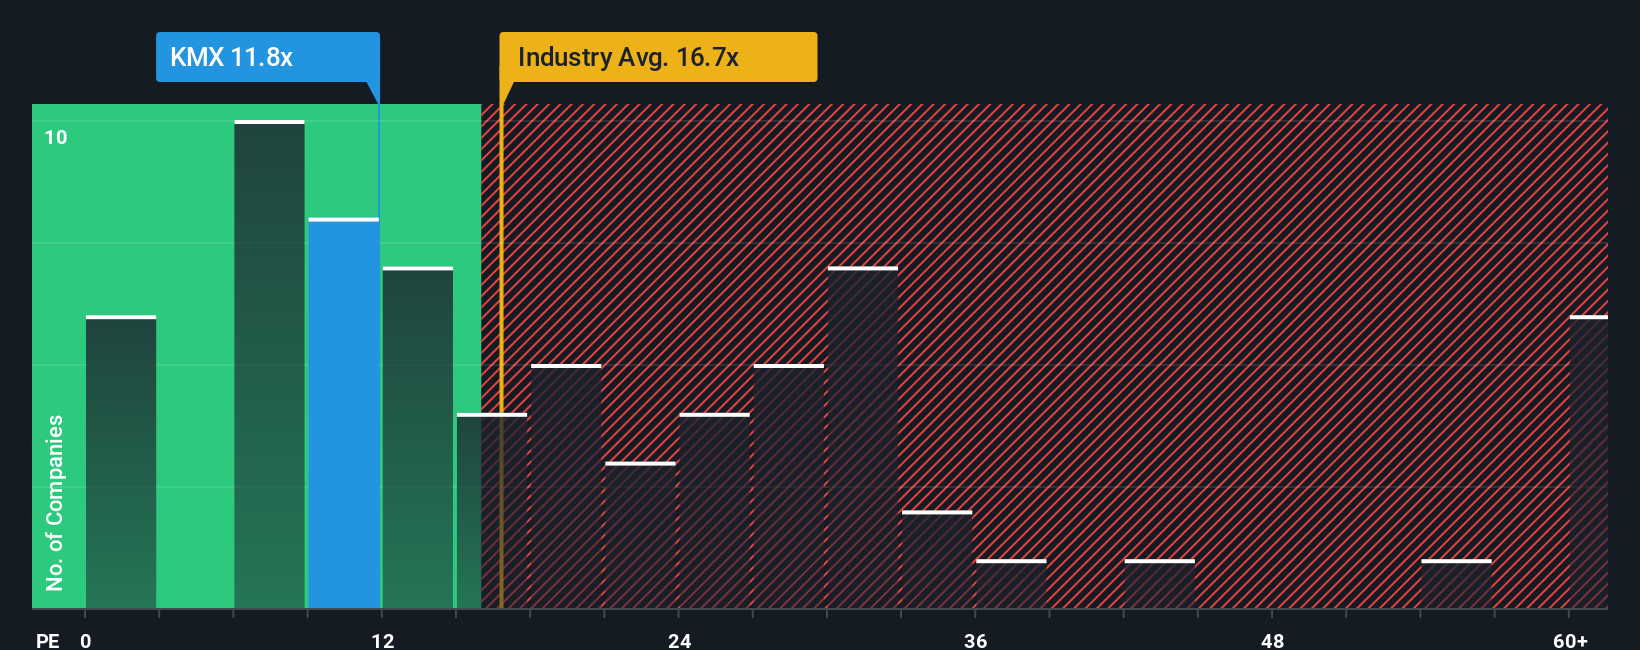
CarMax currently trades on a PE of about 12.0x. That sits slightly below both its peer group average of roughly 12.3x and well below the broader Specialty Retail industry average of around 20.3x, indicating that the market is assigning a discount to the stock relative to many retailers.
Simply Wall St also calculates a Fair Ratio for CarMax of 18.7x, which is an estimate of the PE the company might reasonably command given its earnings growth profile, margins, industry, size, and risk characteristics. This is more tailored than simple peer or industry comparisons because it factors in CarMax specific qualities rather than assuming all retailers should trade on the same multiple. With the Fair Ratio meaningfully above the current 12.0x, the shares appear undervalued on this metric.
Result: UNDERVALUED
PE ratios tell one story, but what if the real opportunity lies elsewhere? Discover 1465 companies where insiders are betting big on explosive growth.
Upgrade Your Decision Making: Choose your CarMax Narrative
Earlier we mentioned that there is an even better way to understand valuation, so let us introduce you to Narratives, a simple framework on Simply Wall St’s Community page that lets you attach a clear story to your numbers. You do this by linking your view of CarMax’s business drivers to a specific forecast for revenue, earnings and margins, and then to a Fair Value you can compare against today’s share price to decide whether to buy, hold or sell. This all updates dynamically when new news or earnings are released so your thesis always reflects the latest information. For example, one CarMax Narrative might assume that digital sales, broader credit spectrum lending and cost efficiencies play out well, supporting a Fair Value near the higher end of current targets around $120. A more cautious Narrative could emphasize execution risks, credit quality concerns and pressure from digital first rivals to arrive at a much lower Fair Value closer to $52. This neatly illustrates how different, but structured, perspectives on the same company can lead to very different investment conclusions.
Do you think there's more to the story for CarMax? Head over to our Community to see what others are saying!
This article by Simply Wall St is general in nature. We provide commentary based on historical data and analyst forecasts only using an unbiased methodology and our articles are not intended to be financial advice. It does not constitute a recommendation to buy or sell any stock, and does not take account of your objectives, or your financial situation. We aim to bring you long-term focused analysis driven by fundamental data. Note that our analysis may not factor in the latest price-sensitive company announcements or qualitative material. Simply Wall St has no position in any stocks mentioned.
Have feedback on this article? Concerned about the content? Get in touch with us directly. Alternatively, email editorial-team@simplywallst.com