
 Nasdaq
 華爾街日報
華爾街日報Is It Time To Reassess e.l.f. Beauty After Its Major Multi Year Share Price Surge?
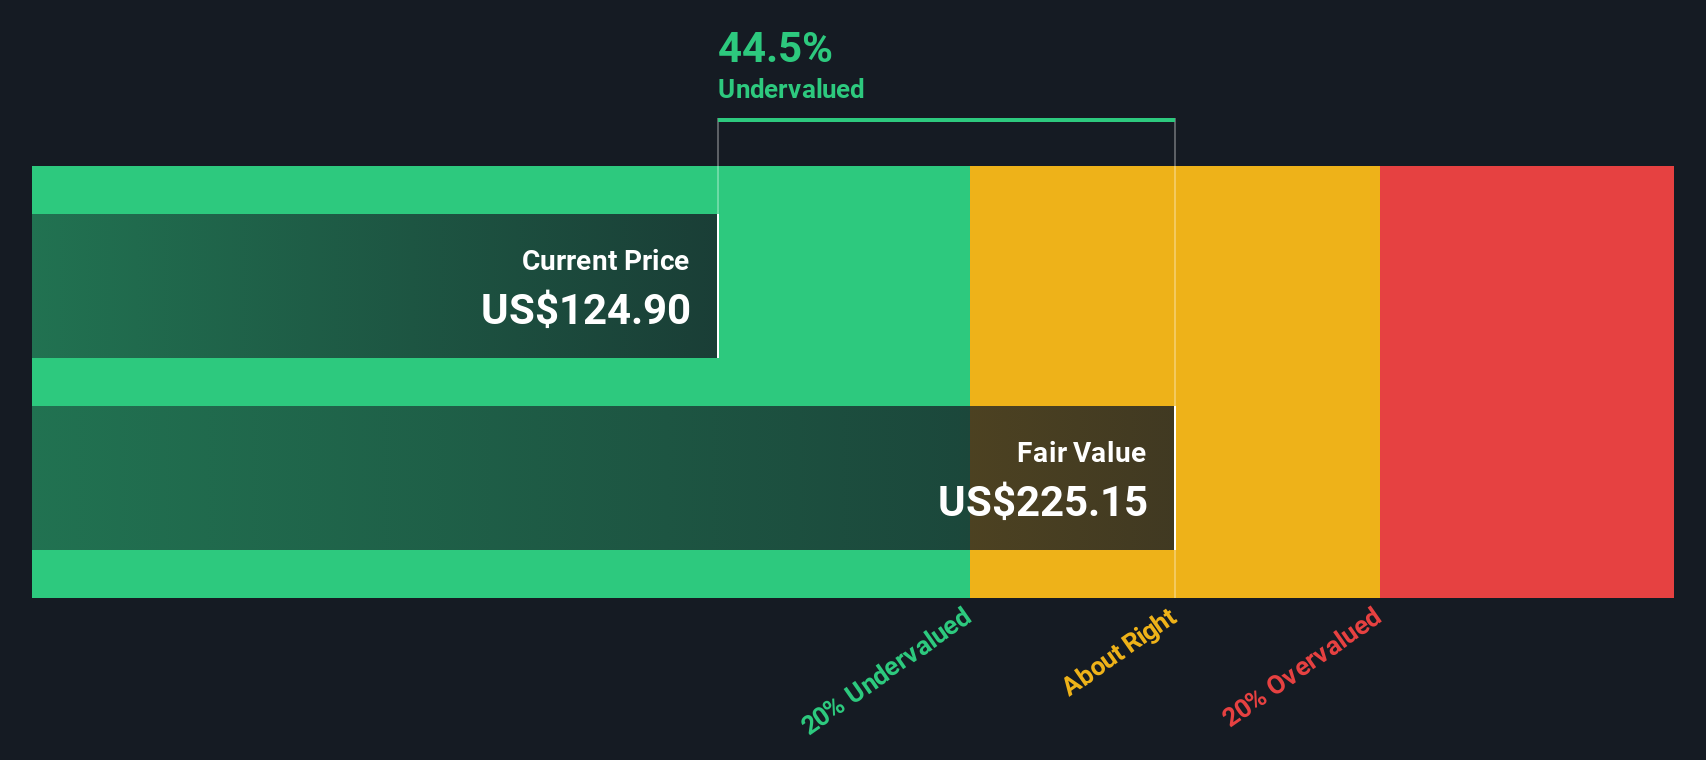
- If you are wondering whether e.l.f. Beauty is a bargain again or still priced for perfection, especially after its huge multi year run, you are not alone in trying to figure out what a fair entry point looks like now.
- The stock has bounced recently, rising 5.3% over the last week and 12.9% over the past month. That is still against a much tougher backdrop, with returns of -34.6% year to date and -37.5% over the last year, following a 47.7% gain over three years and a 244.6% gain over five years.
- Recent headlines have focused on e.l.f. expanding shelf space with key retail partners and continuing to grab market share from legacy beauty brands. This reinforces the idea that it is a structural winner rather than just a pandemic era fad. The company has also drawn attention for high profile marketing tie ups and its push into skin care, which helps explain why investors remain willing to look through near term volatility.
- Despite the hype, our valuation framework only gives e.l.f. Beauty a 1 out of 6 score on undervaluation checks. In the rest of this article we will break down what different valuation methods say about the stock and then finish by looking at a more nuanced way to think about what it is really worth.
e.l.f. Beauty scores just 1/6 on our valuation checks. See what other red flags we found in the full valuation breakdown.
Approach 1: e.l.f. Beauty Discounted Cash Flow (DCF) Analysis
A Discounted Cash Flow, or DCF, model estimates what a company is worth today by projecting its future cash flows and discounting them back to a present value.
For e.l.f. Beauty, the model uses a 2 stage Free Cash Flow to Equity approach, starting from last twelve month free cash flow of about $154.7 Million. Analyst and extrapolated forecasts then project annual free cash flow through 2035, with near term estimates such as $47 Million in 2026 and $198 Million in 2027, before moderating to around $37.5 Million by 2035 as growth normalizes.
When all those projected cash flows are discounted back and combined with a terminal value, the DCF suggests an intrinsic value of roughly $15.12 per share. Compared with the current market price, this implies the stock is about 432.0% overvalued, a very wide gap that leaves little margin for error if growth disappoints.
Result: OVERVALUED
Our Discounted Cash Flow (DCF) analysis suggests e.l.f. Beauty may be overvalued by 432.0%. Discover 914 undervalued stocks or create your own screener to find better value opportunities.
Approach 2: e.l.f. Beauty Price vs Earnings
For profitable companies like e.l.f. Beauty, the price to earnings (PE) ratio is a useful shorthand for how much investors are willing to pay for each dollar of current profit. It naturally links valuation to the bottom line, which is ultimately what equities are priced on over the long run.
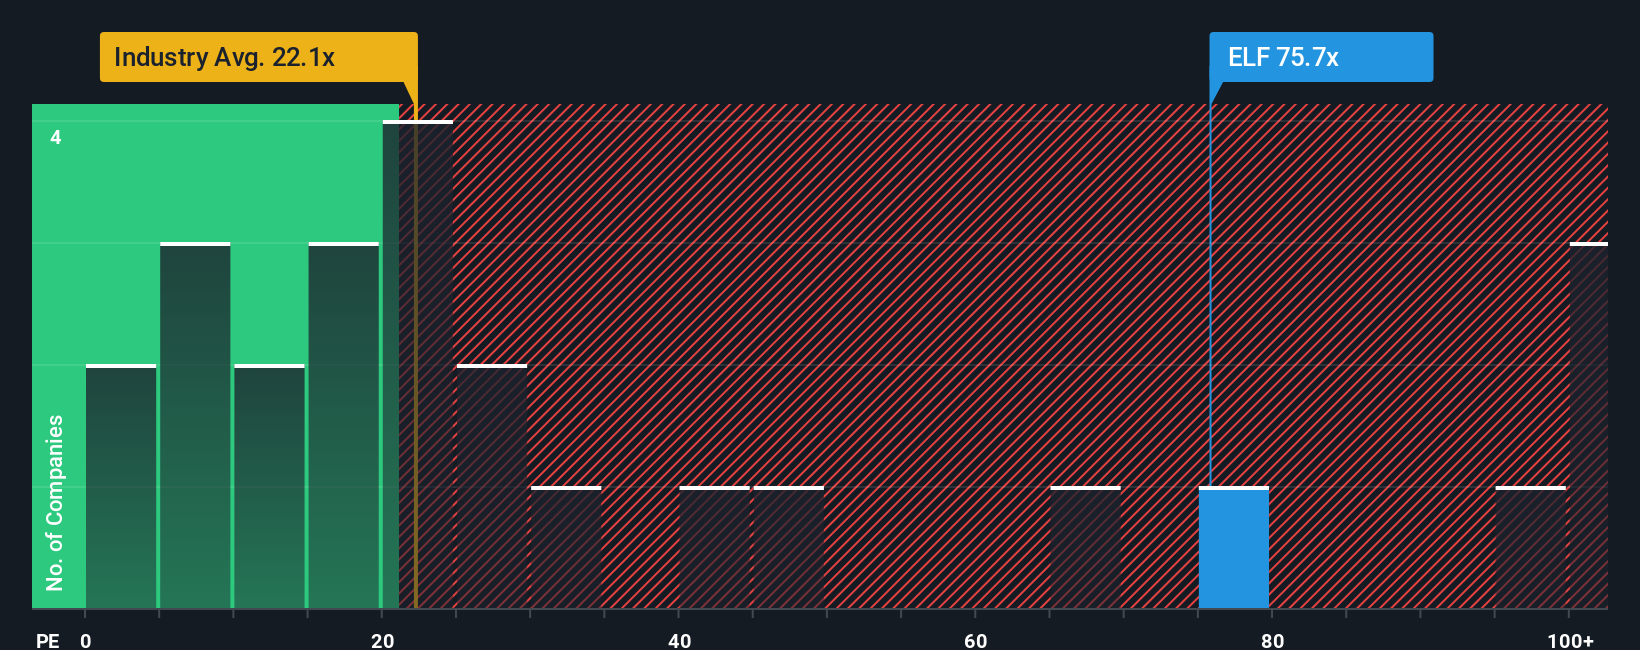
What counts as a normal or fair PE depends on how quickly earnings are expected to grow and how risky those earnings are. Faster, more reliable growth usually justifies a higher multiple, while slower or more uncertain growth tends to mean a lower one. Against that backdrop, e.l.f. currently trades on a PE of about 58.6x, which is well above the personal products industry average of roughly 22.7x and also ahead of a peer group average of about 14.7x.
Simply Wall St’s Fair Ratio framework estimates that, given e.l.f.’s growth profile, margins, industry, size, and risk factors, a more appropriate PE would be around 42.1x. This Fair Ratio is more informative than simple peer or industry comparisons because it explicitly adjusts for company specific fundamentals rather than assuming all firms deserve similar multiples. Comparing the Fair Ratio of 42.1x with the current 58.6x suggests the shares are trading richer than what those fundamentals justify.
Result: OVERVALUED
PE ratios tell one story, but what if the real opportunity lies elsewhere? Discover 1465 companies where insiders are betting big on explosive growth.
Upgrade Your Decision Making: Choose your e.l.f. Beauty Narrative
Earlier we mentioned that there is an even better way to understand valuation, so let us introduce you to Narratives, a simple way to attach a story and your view on a company’s future revenue, earnings and margins to the numbers you see on a forecast and fair value chart.
A Narrative connects three pieces together: the company’s business story, the financial forecast that flows from that story, and the resulting fair value estimate, so you can clearly see why a certain price might be justified.
On Simply Wall St, millions of investors explore and create Narratives on the Community page. There you can quickly adopt or adapt a Narrative that matches your view without needing to build a complex model yourself.
Each Narrative compares its fair value to the current share price to help you consider whether e.l.f. Beauty might align with a buy, hold, or sell view based on that story. It also updates dynamically as new news, earnings and guidance come in so your view stays current without extra work.
For example, one e.l.f. Beauty Narrative might focus on ongoing market share gains and indicate a fair value around $165 per share. A more cautious Narrative, focused on tariffs and competition, might point to a fair value closer to $112. Both can coexist on the platform for you to explore.
Do you think there's more to the story for e.l.f. Beauty? Head over to our Community to see what others are saying!

This article by Simply Wall St is general in nature. We provide commentary based on historical data and analyst forecasts only using an unbiased methodology and our articles are not intended to be financial advice. It does not constitute a recommendation to buy or sell any stock, and does not take account of your objectives, or your financial situation. We aim to bring you long-term focused analysis driven by fundamental data. Note that our analysis may not factor in the latest price-sensitive company announcements or qualitative material. Simply Wall St has no position in any stocks mentioned.
Have feedback on this article? Concerned about the content? Get in touch with us directly. Alternatively, email editorial-team@simplywallst.com