
 Nasdaq
 華爾街日報
華爾街日報Is Getlink’s Recent Traffic Recovery Already Reflected in Its 2025 Valuation?
- Wondering if Getlink is quietly becoming good value, or if the recent price leaves little upside on the table? Let us unpack what the market is really pricing into this cross Channel operator.
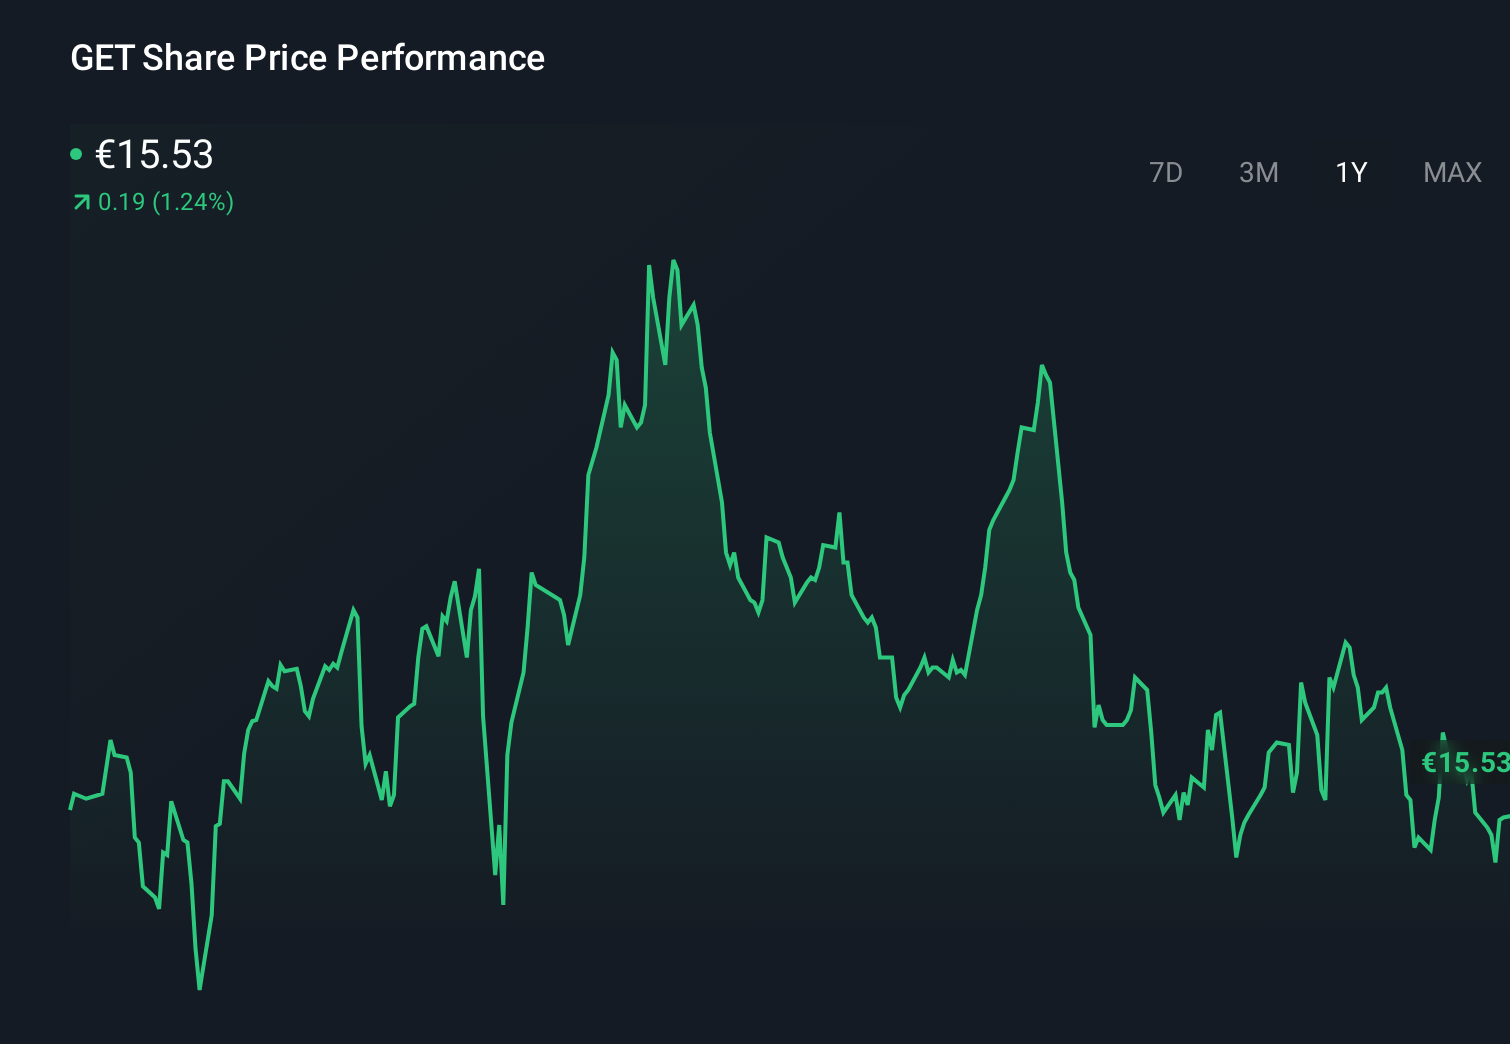
- The share price has edged up 1.4% over the last week and 1.0% over the last month, yet it is still roughly flat year to date at -0.6%, with a steadier 4.9% gain over the past year.
- Recent headlines have focused on traffic recovery through the Channel Tunnel and ongoing infrastructure investment plans. Both of these factors shape expectations for long term cash flows. At the same time, discussion about European transport policy and cross border connectivity has put Getlink back on the radar for investors thinking about structural growth drivers.
- Despite that backdrop, Getlink only scores 1 out of 6 on our undervaluation checks. This suggests the market may already be pricing in a lot of the good news, at least on traditional metrics. We will walk through those methods next before exploring a more complete way to think about valuation later in the article.
Getlink scores just 1/6 on our valuation checks. See what other red flags we found in the full valuation breakdown.
Approach 1: Getlink Discounted Cash Flow (DCF) Analysis
The Discounted Cash Flow model estimates what a company is worth by projecting the cash it can generate in the future and discounting those cash flows back to a single value today.
For Getlink, the model starts from last twelve months Free Cash Flow of about €672.2 Million and uses analyst forecasts for the next few years, then extrapolates further. By 2027, annual Free Cash Flow is projected at roughly €372.5 Million, and the longer term projections gradually step down to around €224.1 Million by 2035, reflecting expectations that the current cash flow strength will normalise over time.
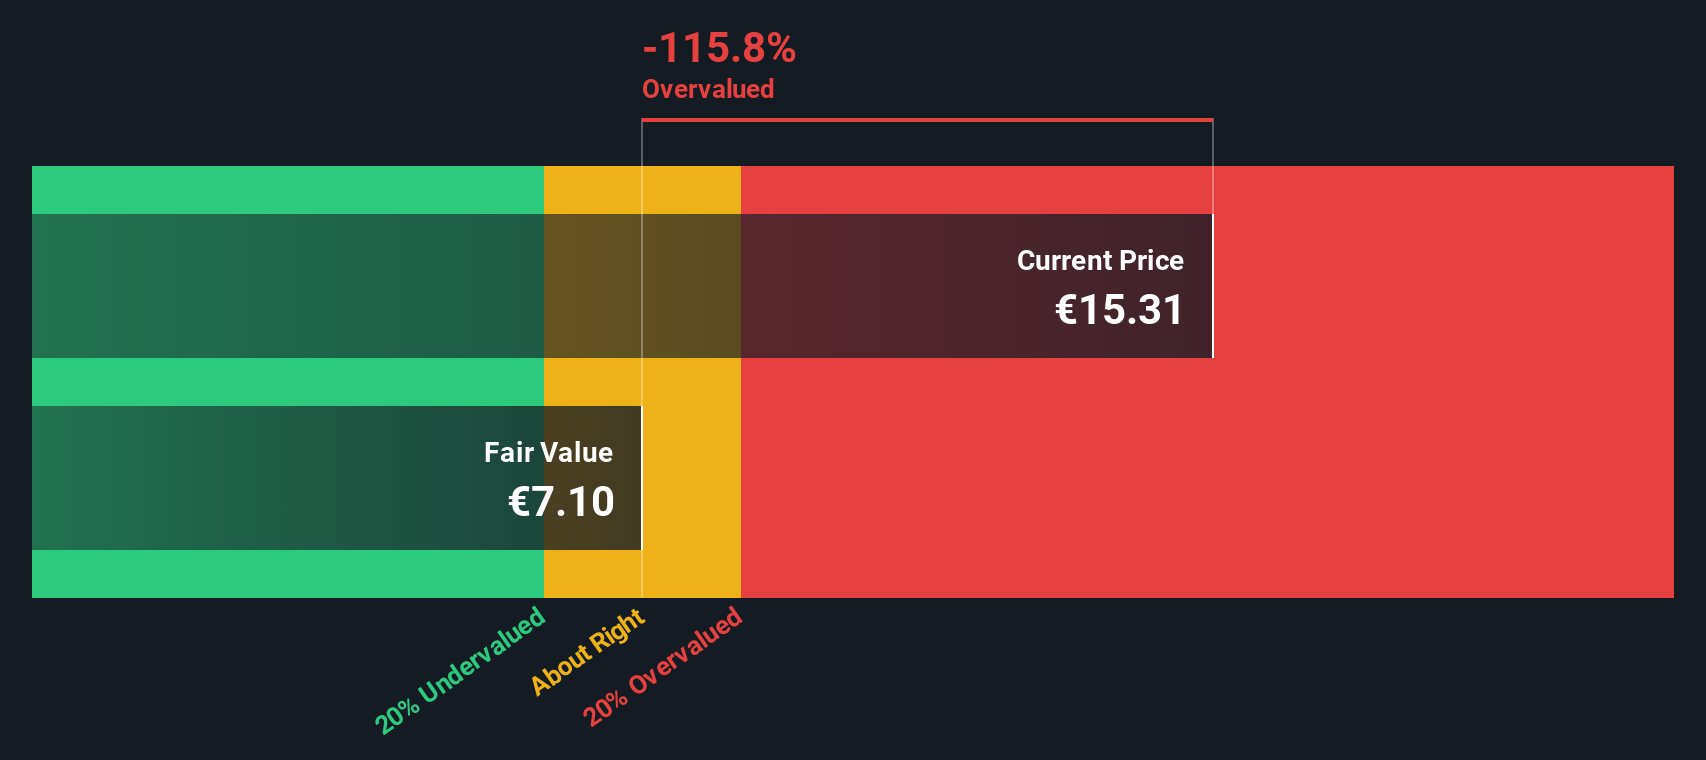
Aggregating and discounting these future cash flows, the 2 Stage Free Cash Flow to Equity model arrives at an intrinsic value of about €7.66 per share. Compared with the current market price, this implies the shares are about 102.8% overvalued on a pure cash flow basis. This suggests limited margin of safety for new investors at today’s level.
Result: OVERVALUED
Our Discounted Cash Flow (DCF) analysis suggests Getlink may be overvalued by 102.8%. Discover 914 undervalued stocks or create your own screener to find better value opportunities.
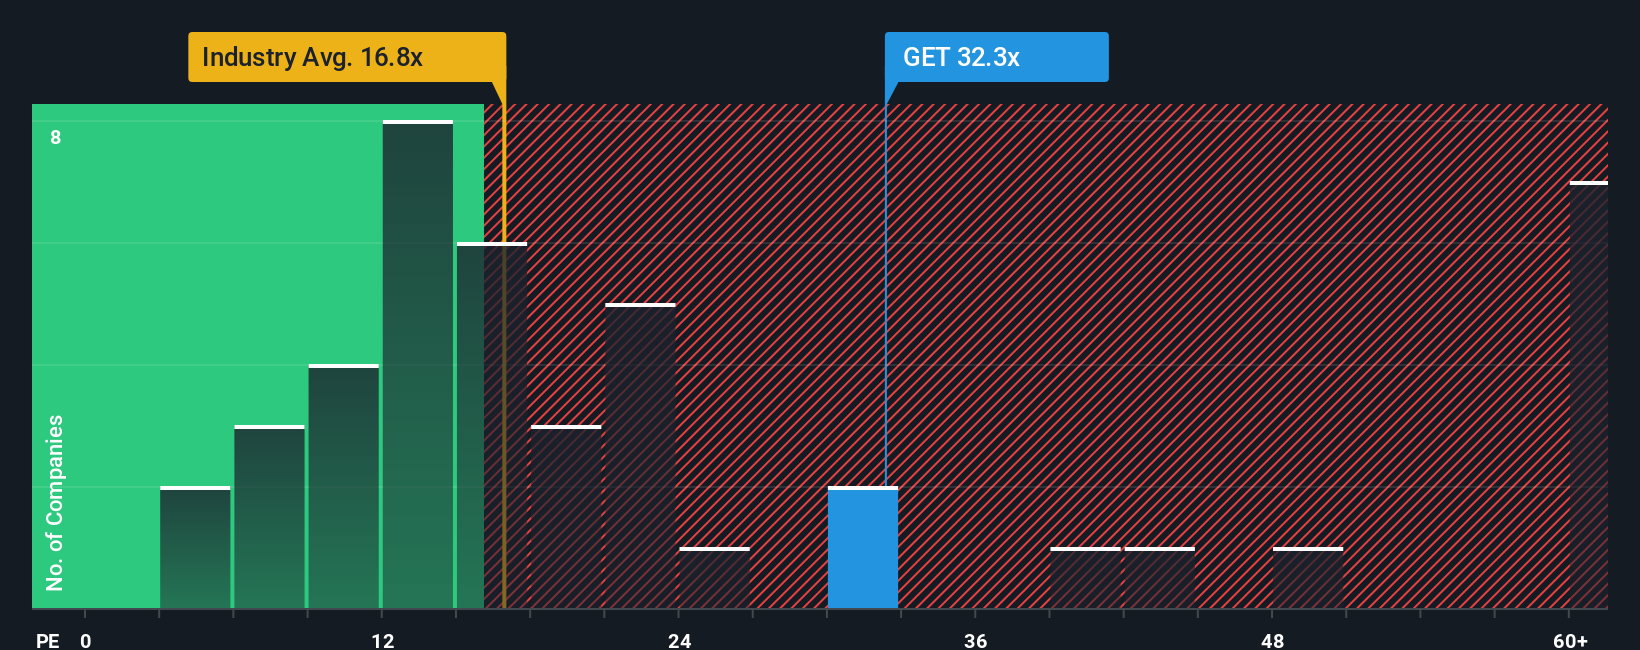
Approach 2: Getlink Price vs Earnings
For profitable, established companies like Getlink, the Price to Earnings ratio is a useful shorthand for how much investors are willing to pay for each euro of profit today. It naturally links valuation to the bottom line that ultimately supports dividends, buybacks and reinvestment.
In general, faster growth and lower perceived risk justify a higher PE ratio, while slower growth or higher uncertainty call for a lower one. Getlink currently trades on about 32.8x earnings, which is above the broader Infrastructure industry average of roughly 14.7x but below the 37.3x average of its listed peers. That spread suggests the market already assigns Getlink a quality and growth premium versus the sector overall.
Simply Wall St’s Fair Ratio, at about 16.9x, is a proprietary estimate of what Getlink’s PE should be once its earnings growth outlook, profit margins, industry positioning, market cap and risk profile are all considered together. This tailored benchmark is more informative than a simple peer or industry comparison because it adjusts for Getlink’s specific fundamentals instead of assuming all Infrastructure companies deserve similar multiples. With the current PE of 32.8x sitting well above the 16.9x Fair Ratio, the stock appears expensive on this framework.
Result: OVERVALUED
PE ratios tell one story, but what if the real opportunity lies elsewhere? Discover 1465 companies where insiders are betting big on explosive growth.
Upgrade Your Decision Making: Choose your Getlink Narrative
Earlier we mentioned that there is an even better way to understand valuation, so let us introduce you to Narratives, a simple way to connect your view of a company with the numbers that sit behind its fair value. A Narrative is your story about Getlink, or any company, translated into assumptions about future revenue, earnings and margins, which then flow into a financial forecast and, ultimately, a fair value estimate. On Simply Wall St, millions of investors build and share these Narratives on the Community page, making it an easy and accessible tool rather than something only professionals can do. Narratives help you decide when to buy or sell by comparing your Fair Value to the current market price, and they update automatically as new data, news or earnings are released. For example, some investors on the platform see Getlink's fair value well below today’s price, while others, using different growth and risk assumptions, arrive at a fair value materially above the current market level.
Do you think there's more to the story for Getlink? Head over to our Community to see what others are saying!
This article by Simply Wall St is general in nature. We provide commentary based on historical data and analyst forecasts only using an unbiased methodology and our articles are not intended to be financial advice. It does not constitute a recommendation to buy or sell any stock, and does not take account of your objectives, or your financial situation. We aim to bring you long-term focused analysis driven by fundamental data. Note that our analysis may not factor in the latest price-sensitive company announcements or qualitative material. Simply Wall St has no position in any stocks mentioned.
Have feedback on this article? Concerned about the content? Get in touch with us directly. Alternatively, email editorial-team@simplywallst.com