
 Nasdaq
 華爾街日報
華爾街日報Is RWE Stock Still Attractive After a 63% Surge Amid Energy Transition Optimism?
- Wondering if RWE has quietly turned into one of the more interesting value ideas in European utilities? You are not alone, and the headline numbers only tell part of the story.
- The stock has climbed 2.7% over the last week, 1.5% over the past month, and is now up a striking 50.8% year to date and 63.0% over the last year. That naturally raises the question of whether the current price still stacks up.
- Those gains have come as investors refocus on RWE's role in the European energy transition, with markets increasingly rewarding companies that can scale renewables while managing legacy conventional assets. Policy support for cleaner power and ongoing infrastructure investment have helped shift sentiment, framing the stock less as a defensive utility and more as a growth platform in a changing energy landscape.
- Even so, our initial look at the numbers gives RWE a valuation score of 2 out of 6. This suggests that on several fronts the stock may already be pricing in a lot of good news. The rest of this article will unpack what that means through different valuation lenses before we circle back to an even deeper way of thinking about RWE's true worth.
RWE scores just 2/6 on our valuation checks. See what other red flags we found in the full valuation breakdown.
Approach 1: RWE Dividend Discount Model (DDM) Analysis
The Dividend Discount Model estimates what a share is worth by projecting all future dividends, growing them at a steady rate, and discounting them back to today. It is a dividend focused lens rather than one based on earnings or cash flows.
For RWE, the model starts with an annual dividend per share of €1.33 and assumes a long term dividend growth rate of 1.56%, capped down from a higher historical rate to reflect more conservative expectations. With a return on equity of about 10.6% and a payout ratio of roughly 28%, the implication is that most profits are reinvested to fund growth while still leaving room for gradually rising dividends over time.
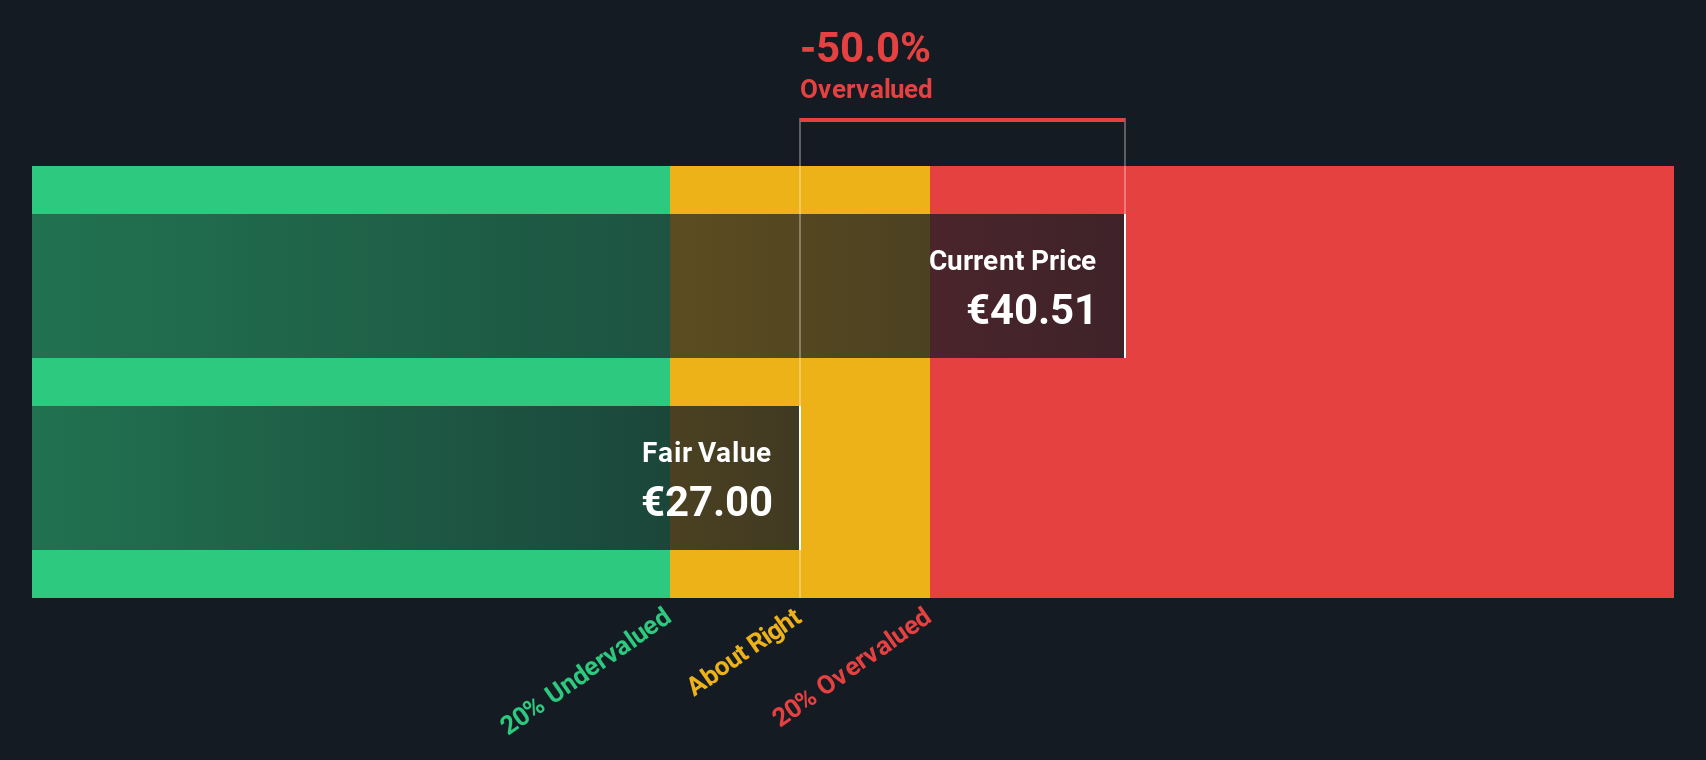
Using these inputs in the DDM produces an estimated intrinsic value of about €27.21 per share. Compared with the current market price, this output suggests the stock is roughly 63.8% overvalued, indicating that the market appears to be pricing in much stronger dividend growth than this model assumes.
Result: OVERVALUED
Our Dividend Discount Model (DDM) analysis suggests RWE may be overvalued by 63.8%. Discover 914 undervalued stocks or create your own screener to find better value opportunities.
Approach 2: RWE Price vs Earnings
For a consistently profitable company like RWE, the price to earnings multiple is a practical way to gauge how much investors are paying for each unit of earnings. In general, faster growing and lower risk businesses deserve higher PE ratios, while slower or riskier names should trade on more modest multiples.
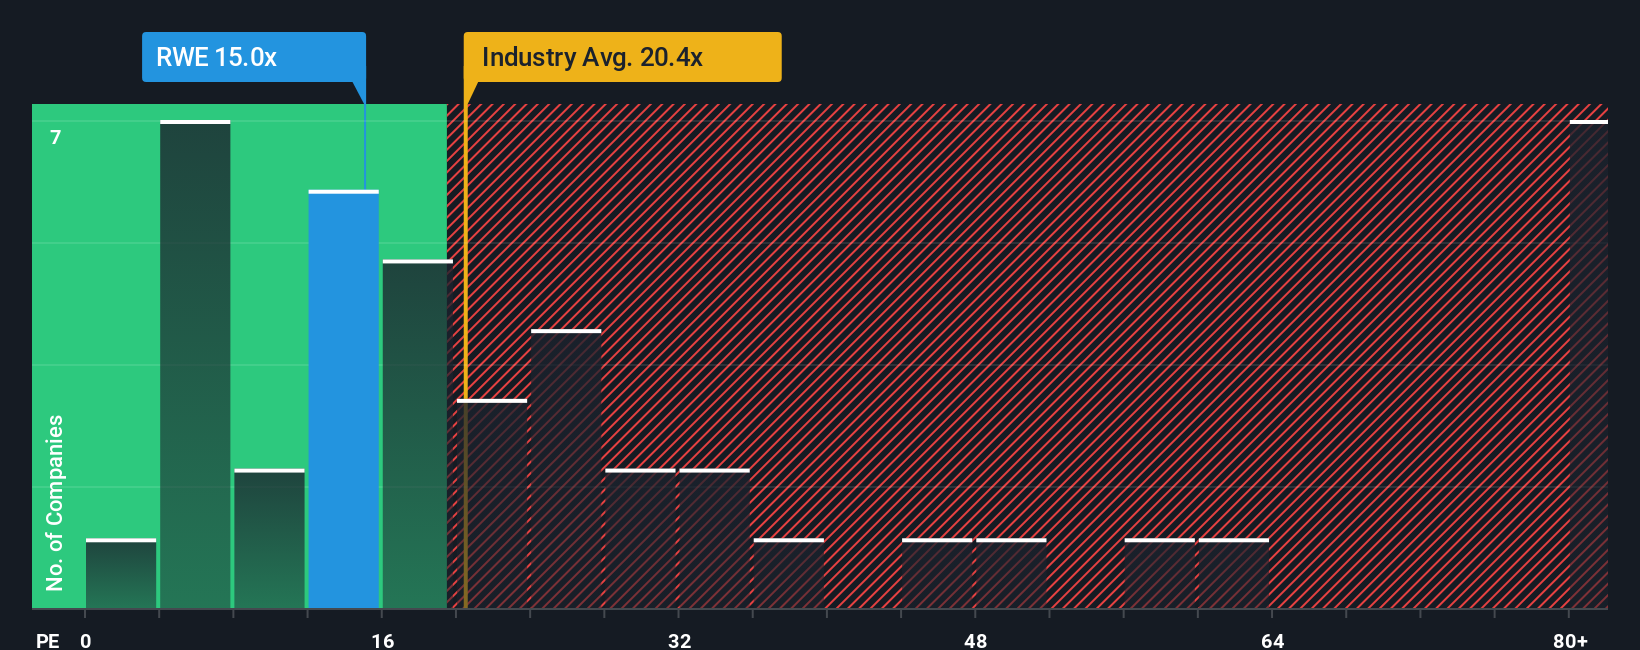
RWE currently trades on a PE of 14.79x, which is slightly below the broader renewable energy industry average of about 16.65x and well below the peer group average of roughly 47.78x. On the surface that can make the stock look inexpensive, but raw comparisons can be misleading because they ignore company specific factors.
Simply Wall St's Fair Ratio tackles this by estimating what PE RWE should trade on, given its own earnings growth outlook, margins, risk profile, industry position and market cap. For RWE, that Fair Ratio is 9.45x, implying that, after adjusting for these fundamentals, the shares are trading at a premium to what would be considered normal for this business.
Result: OVERVALUED
PE ratios tell one story, but what if the real opportunity lies elsewhere? Discover 1466 companies where insiders are betting big on explosive growth.
Upgrade Your Decision Making: Choose your RWE Narrative
Earlier we mentioned that there is an even better way to understand valuation, so let's introduce you to Narratives, which are simply your story about a company linked directly to the numbers you think are realistic for its future revenue, earnings, margins and fair value. On Simply Wall St's Community page, used by millions of investors, a Narrative turns your view on RWE into a complete forecast and valuation by connecting what you believe about its renewables pipeline, policy support and risks to a set of financial assumptions and a resulting fair value that you can easily compare with today’s share price to decide whether it looks like a buy, hold or sell. Because Narratives on the platform update dynamically as new news, earnings or guidance arrive, they stay current rather than static. For example, one RWE Narrative might assume stronger policy support, higher long term margins near 8.8%, revenue growth closer to 6.8% and a future PE around 17.4x to reach a fair value near €49. In contrast, a more cautious Narrative could lean on weaker growth, thinner margins and a lower multiple to land closer to €36, showing how two reasonable perspectives can produce very different signals from the same company.
Do you think there's more to the story for RWE? Head over to our Community to see what others are saying!

This article by Simply Wall St is general in nature. We provide commentary based on historical data and analyst forecasts only using an unbiased methodology and our articles are not intended to be financial advice. It does not constitute a recommendation to buy or sell any stock, and does not take account of your objectives, or your financial situation. We aim to bring you long-term focused analysis driven by fundamental data. Note that our analysis may not factor in the latest price-sensitive company announcements or qualitative material. Simply Wall St has no position in any stocks mentioned.
Have feedback on this article? Concerned about the content? Get in touch with us directly. Alternatively, email editorial-team@simplywallst.com