
 Nasdaq
 華爾街日報
華爾街日報Is It Too Late To Invest In TechnipFMC After Its 575% Five Year Surge?
- If you have been wondering whether TechnipFMC is still a smart buy after its huge run, you are not alone. This stock is exactly the kind investors worry they might be late to.
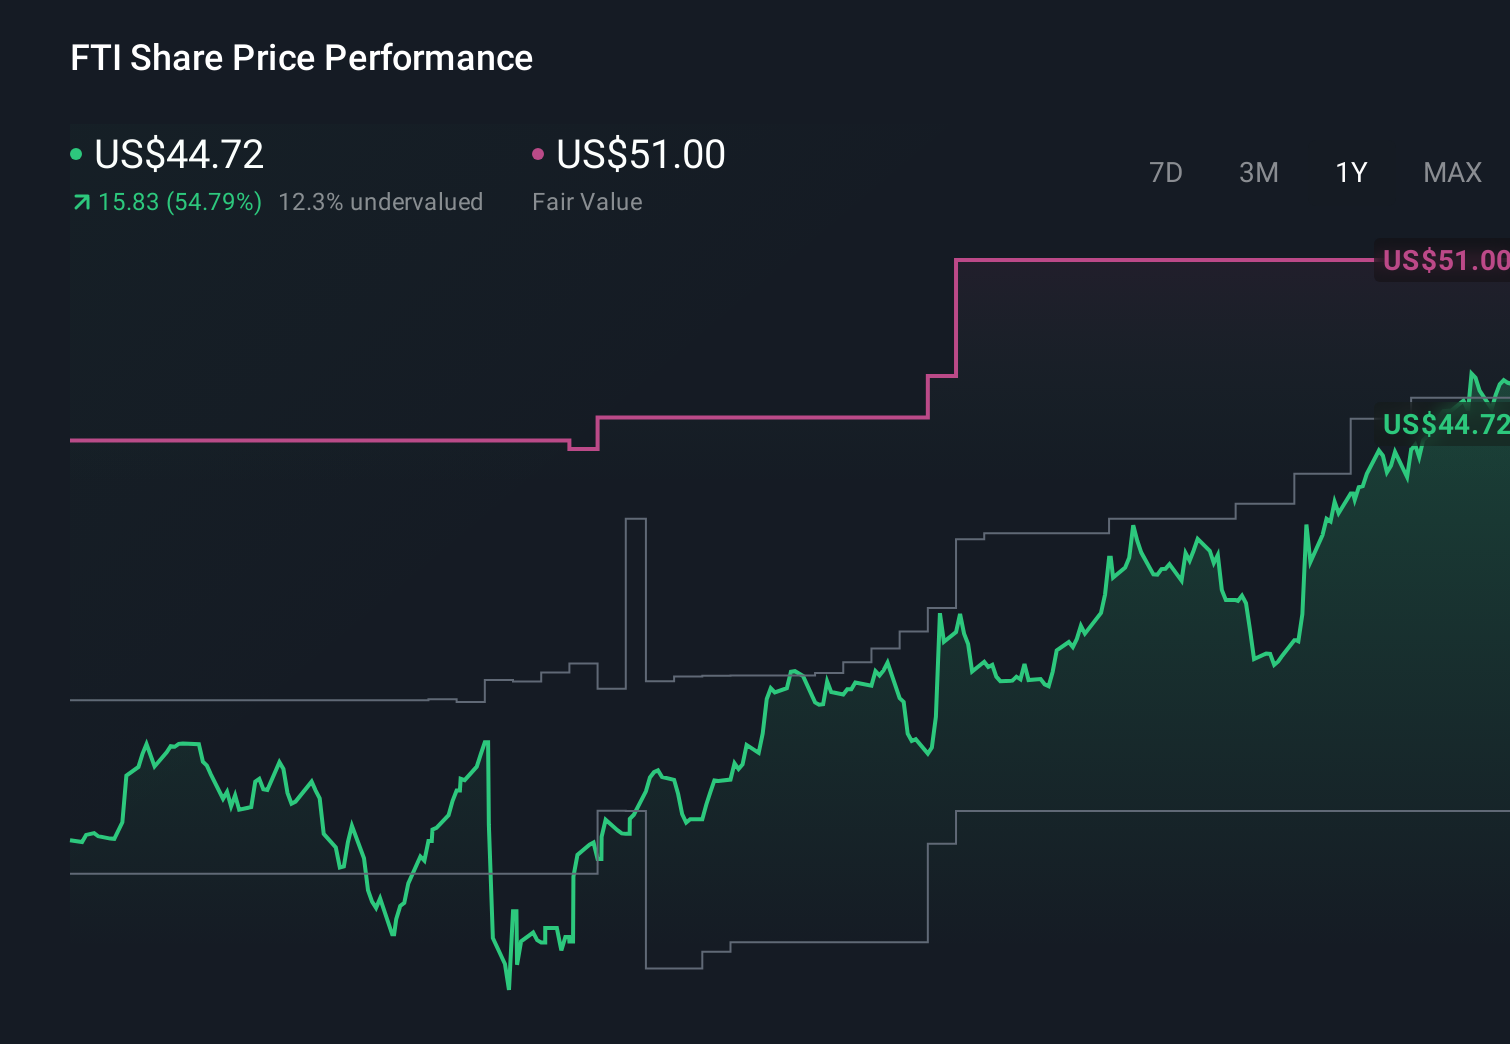
- Despite a recent dip of 3.5% over the last week, the shares are still up 1.7% over 30 days, 51.2% year to date, 55.7% over the last year and an eye catching 575.0% over five years, which says a lot about how the market view of its prospects has evolved.
- Part of this momentum reflects growing optimism around offshore and subsea energy projects, where TechnipFMC has been picking up major contract wins and expanding its backlog. At the same time, broader energy market dynamics and capital discipline narratives have pushed investors to re rate companies seen as critical infrastructure partners rather than just cyclical suppliers.
- Even after that rally, TechnipFMC only scores 2/6 on our valuation checks, which means it screens as undervalued on two metrics but not on the rest. In the next sections we will walk through those different valuation lenses and then finish with a more holistic way to think about what the market might really be pricing in.
TechnipFMC scores just 2/6 on our valuation checks. See what other red flags we found in the full valuation breakdown.
Approach 1: TechnipFMC Discounted Cash Flow (DCF) Analysis
A Discounted Cash Flow model takes the cash TechnipFMC is expected to generate in the future, then discounts those cash flows back to today to estimate what the business is worth right now.
TechnipFMC is currently producing about $1.66 billion in Free Cash Flow, and the 2 Stage Free Cash Flow to Equity model projects that annual cash flows will remain around the $1.2 billion to $1.4 billion range over the coming decade. Analyst estimates cover the next few years, while projections out to 2035 are extrapolated from those views by Simply Wall St using the company’s recent trends and expected offshore cycle dynamics.
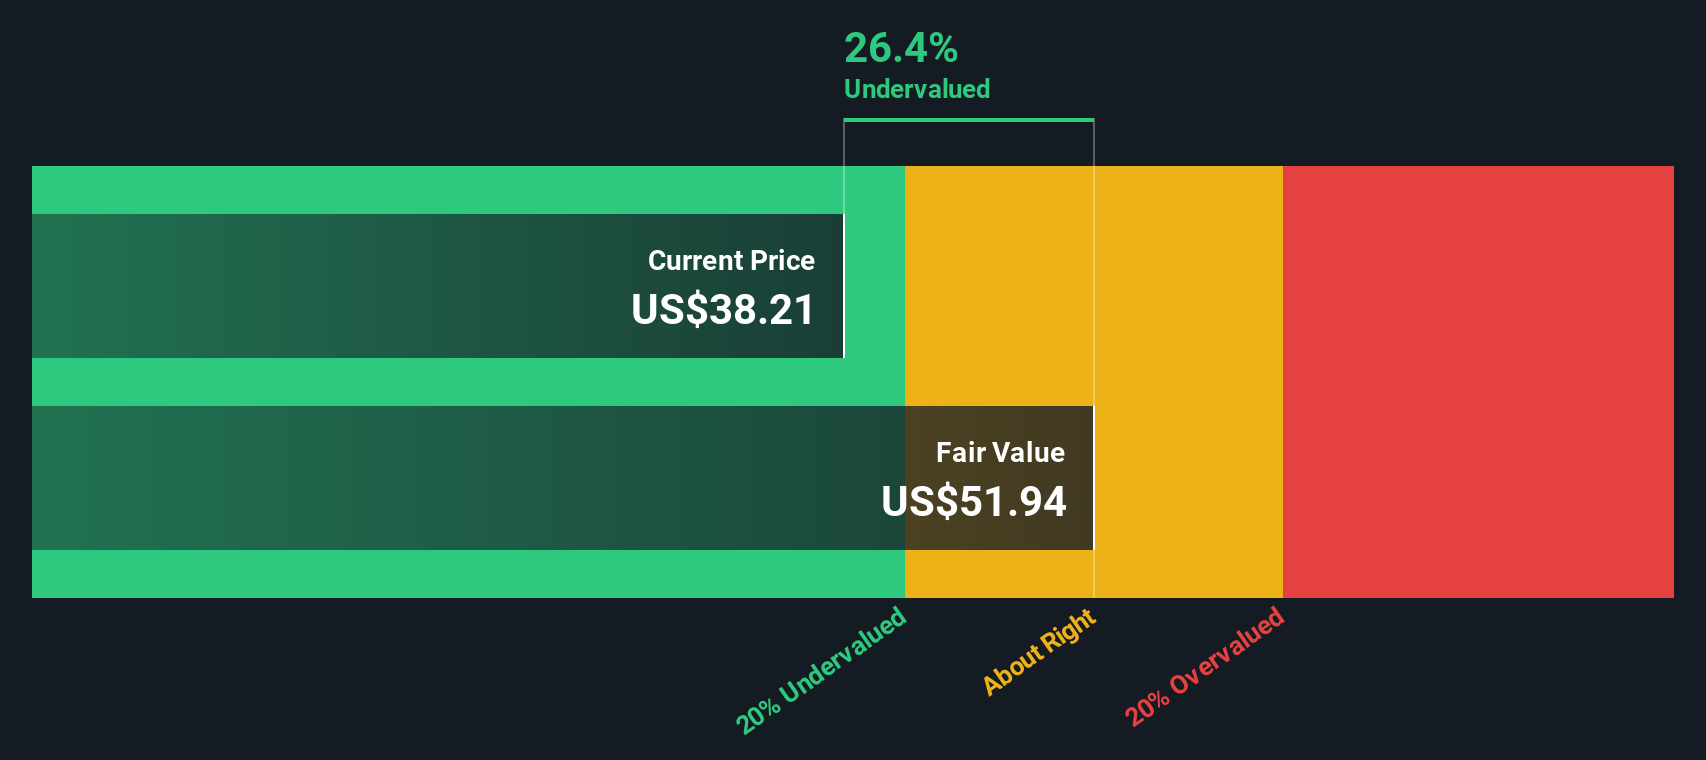
On this basis, the DCF model points to an intrinsic value of about $68.01 per share. Compared to the current share price, that implies a 34.2% discount, suggesting the market is still pricing TechnipFMC below what its long term cash generation potential would justify.
Result: UNDERVALUED
Our Discounted Cash Flow (DCF) analysis suggests TechnipFMC is undervalued by 34.2%. Track this in your watchlist or portfolio, or discover 916 more undervalued stocks based on cash flows.
Approach 2: TechnipFMC Price vs Earnings
For a profitable business like TechnipFMC, the price to earnings ratio is a useful way to gauge how much investors are paying for each dollar of current profits. In general, companies with faster, more reliable earnings growth and lower risk deserve a higher PE multiple, while slower or riskier names tend to trade on a lower one.
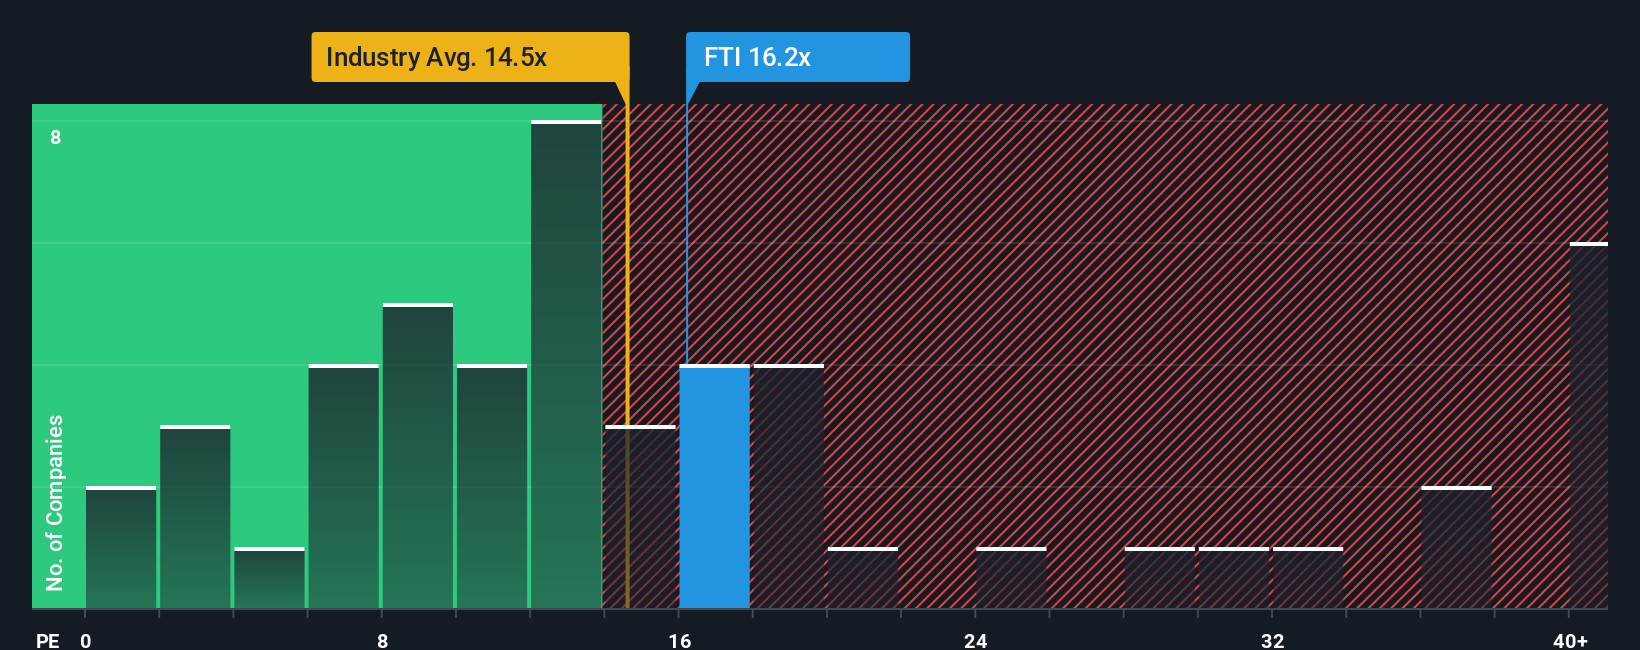
TechnipFMC currently trades on a PE of about 18.6x, a modest premium to the Energy Services industry average of roughly 17.7x and slightly above the peer group at around 15.9x. Simply Wall St also calculates a proprietary Fair Ratio of 17.9x for TechnipFMC, based on its specific combination of earnings growth, margins, size, industry positioning and risk profile. This tailored yardstick is more informative than a simple peer or industry comparison because it adjusts for the factors that actually drive what a stock should reasonably trade at.
With the market multiple just above that Fair Ratio, TechnipFMC looks a little expensive on earnings, but not dramatically so.
Result: OVERVALUED
PE ratios tell one story, but what if the real opportunity lies elsewhere? Discover 1465 companies where insiders are betting big on explosive growth.
Upgrade Your Decision Making: Choose your TechnipFMC Narrative
Earlier we mentioned that there is an even better way to understand valuation. Let us introduce you to Narratives, a simple framework on Simply Wall St’s Community page. Here, you connect your story about TechnipFMC, including what you believe about its future revenue, earnings and margins, to a concrete financial forecast and fair value. You can then compare that fair value to today’s share price to help decide whether the stock fits your view, while the platform keeps your Narrative dynamically updated as new news or earnings arrive.
The framework also allows very different perspectives to coexist. For example, one investor might build a bullish TechnipFMC Narrative around subsea leadership, 5 to 6 percent revenue growth and a fair value near the upper end of analyst targets around $51. Another might take a more cautious view focused on energy transition risks and slower growth, resulting in a fair value closer to the low end near $30. Both investors can see in real time how fresh information shifts the gap between their Fair Value and the current Price.
Do you think there's more to the story for TechnipFMC? Head over to our Community to see what others are saying!
This article by Simply Wall St is general in nature. We provide commentary based on historical data and analyst forecasts only using an unbiased methodology and our articles are not intended to be financial advice. It does not constitute a recommendation to buy or sell any stock, and does not take account of your objectives, or your financial situation. We aim to bring you long-term focused analysis driven by fundamental data. Note that our analysis may not factor in the latest price-sensitive company announcements or qualitative material. Simply Wall St has no position in any stocks mentioned.
Have feedback on this article? Concerned about the content? Get in touch with us directly. Alternatively, email editorial-team@simplywallst.com