
 Nasdaq
 華爾街日報
華爾街日報SIM Technology Group Limited's (HKG:2000) market cap surged HK$85m last week, retail investors who have a lot riding on the company were rewarded
Key Insights
- Significant control over SIM Technology Group by retail investors implies that the general public has more power to influence management and governance-related decisions
- 58% of the business is held by the top 2 shareholders
- Insider ownership in SIM Technology Group is 25%
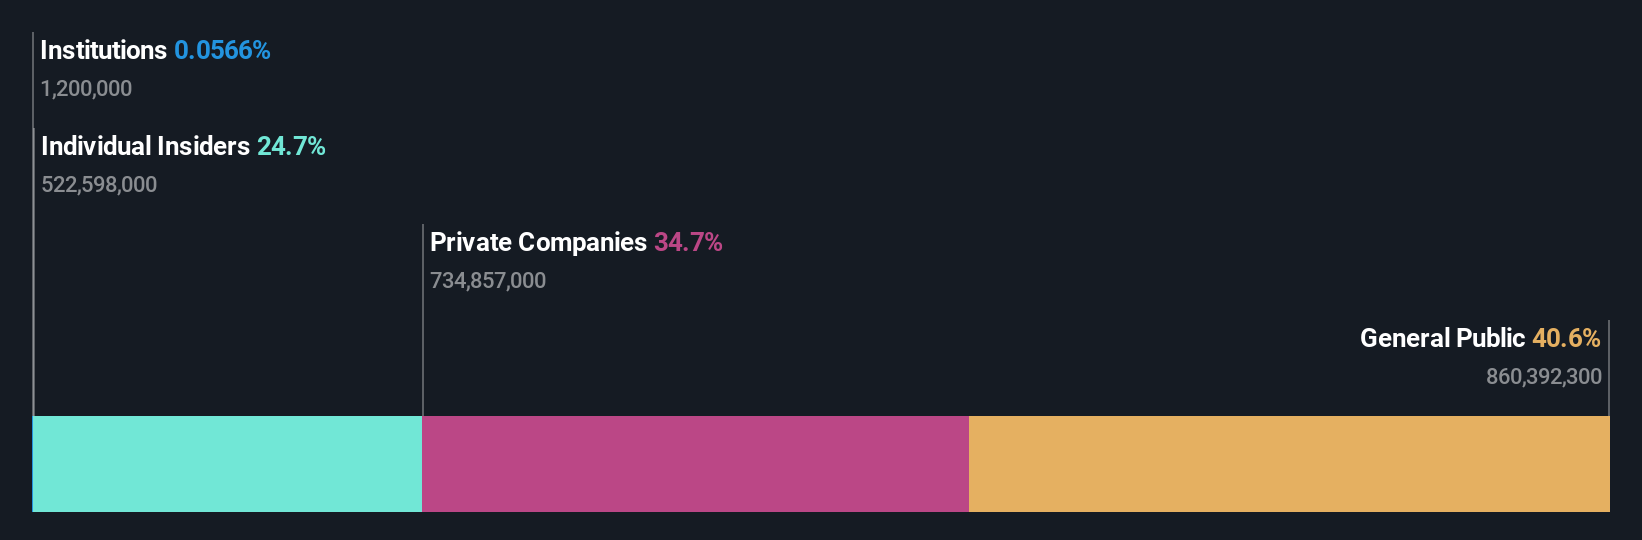
To get a sense of who is truly in control of SIM Technology Group Limited (HKG:2000), it is important to understand the ownership structure of the business. With 41% stake, retail investors possess the maximum shares in the company. In other words, the group stands to gain the most (or lose the most) from their investment into the company.
Clearly, retail investors benefitted the most after the company's market cap rose by HK$85m last week.
Let's delve deeper into each type of owner of SIM Technology Group, beginning with the chart below.
See our latest analysis for SIM Technology Group
What Does The Lack Of Institutional Ownership Tell Us About SIM Technology Group?
Institutional investors often avoid companies that are too small, too illiquid or too risky for their tastes. But it's unusual to see larger companies without any institutional investors.
There are many reasons why a company might not have any institutions on the share registry. It may be hard for institutions to buy large amounts of shares, if liquidity (the amount of shares traded each day) is low. If the company has not needed to raise capital, institutions might lack the opportunity to build a position. Alternatively, there might be something about the company that has kept institutional investors away. SIM Technology Group might not have the sort of past performance institutions are looking for, or perhaps they simply have not studied the business closely.

We note that hedge funds don't have a meaningful investment in SIM Technology Group. Info Dynasty Group Limited is currently the company's largest shareholder with 35% of shares outstanding. In comparison, the second and third largest shareholders hold about 24% and 1.1% of the stock. Note that the second and third-largest shareholders are also President and Member of the Board of Directors, respectively, meaning that the company's top shareholders are insiders.
After doing some more digging, we found that the top 2 shareholders collectively control more than half of the company's shares, implying that they have considerable power to influence the company's decisions.
While studying institutional ownership for a company can add value to your research, it is also a good practice to research analyst recommendations to get a deeper understand of a stock's expected performance. Our information suggests that there isn't any analyst coverage of the stock, so it is probably little known.
Insider Ownership Of SIM Technology Group
The definition of company insiders can be subjective and does vary between jurisdictions. Our data reflects individual insiders, capturing board members at the very least. Management ultimately answers to the board. However, it is not uncommon for managers to be executive board members, especially if they are a founder or the CEO.
Insider ownership is positive when it signals leadership are thinking like the true owners of the company. However, high insider ownership can also give immense power to a small group within the company. This can be negative in some circumstances.
Our most recent data indicates that insiders own a reasonable proportion of SIM Technology Group Limited. Insiders own HK$196m worth of shares in the HK$795m company. It is great to see insiders so invested in the business. It might be worth checking if those insiders have been buying recently.
General Public Ownership
The general public, who are usually individual investors, hold a 41% stake in SIM Technology Group. While this size of ownership may not be enough to sway a policy decision in their favour, they can still make a collective impact on company policies.
Private Company Ownership
It seems that Private Companies own 35%, of the SIM Technology Group stock. Private companies may be related parties. Sometimes insiders have an interest in a public company through a holding in a private company, rather than in their own capacity as an individual. While it's hard to draw any broad stroke conclusions, it is worth noting as an area for further research.
Next Steps:
It's always worth thinking about the different groups who own shares in a company. But to understand SIM Technology Group better, we need to consider many other factors.
I always like to check for a history of revenue growth. You can too, by accessing this free chart of historic revenue and earnings in this detailed graph.
Of course, you might find a fantastic investment by looking elsewhere. So take a peek at this free list of interesting companies.
NB: Figures in this article are calculated using data from the last twelve months, which refer to the 12-month period ending on the last date of the month the financial statement is dated. This may not be consistent with full year annual report figures.
Have feedback on this article? Concerned about the content? Get in touch with us directly. Alternatively, email editorial-team (at) simplywallst.com.
This article by Simply Wall St is general in nature. We provide commentary based on historical data and analyst forecasts only using an unbiased methodology and our articles are not intended to be financial advice. It does not constitute a recommendation to buy or sell any stock, and does not take account of your objectives, or your financial situation. We aim to bring you long-term focused analysis driven by fundamental data. Note that our analysis may not factor in the latest price-sensitive company announcements or qualitative material. Simply Wall St has no position in any stocks mentioned.