
 Nasdaq
 華爾街日報
華爾街日報Reassessing SBI Shinsei Bank (TSE:8303) Valuation After Recent Share Price Recovery
Recent Performance and Investor Context
SBI Shinsei Bank (TSE:8303) has quietly delivered a 7% gain for investors this year, even as its 3 year total return still sits roughly 22% lower. This creates an interesting reset point for expectations.
See our latest analysis for SBI Shinsei Bank.
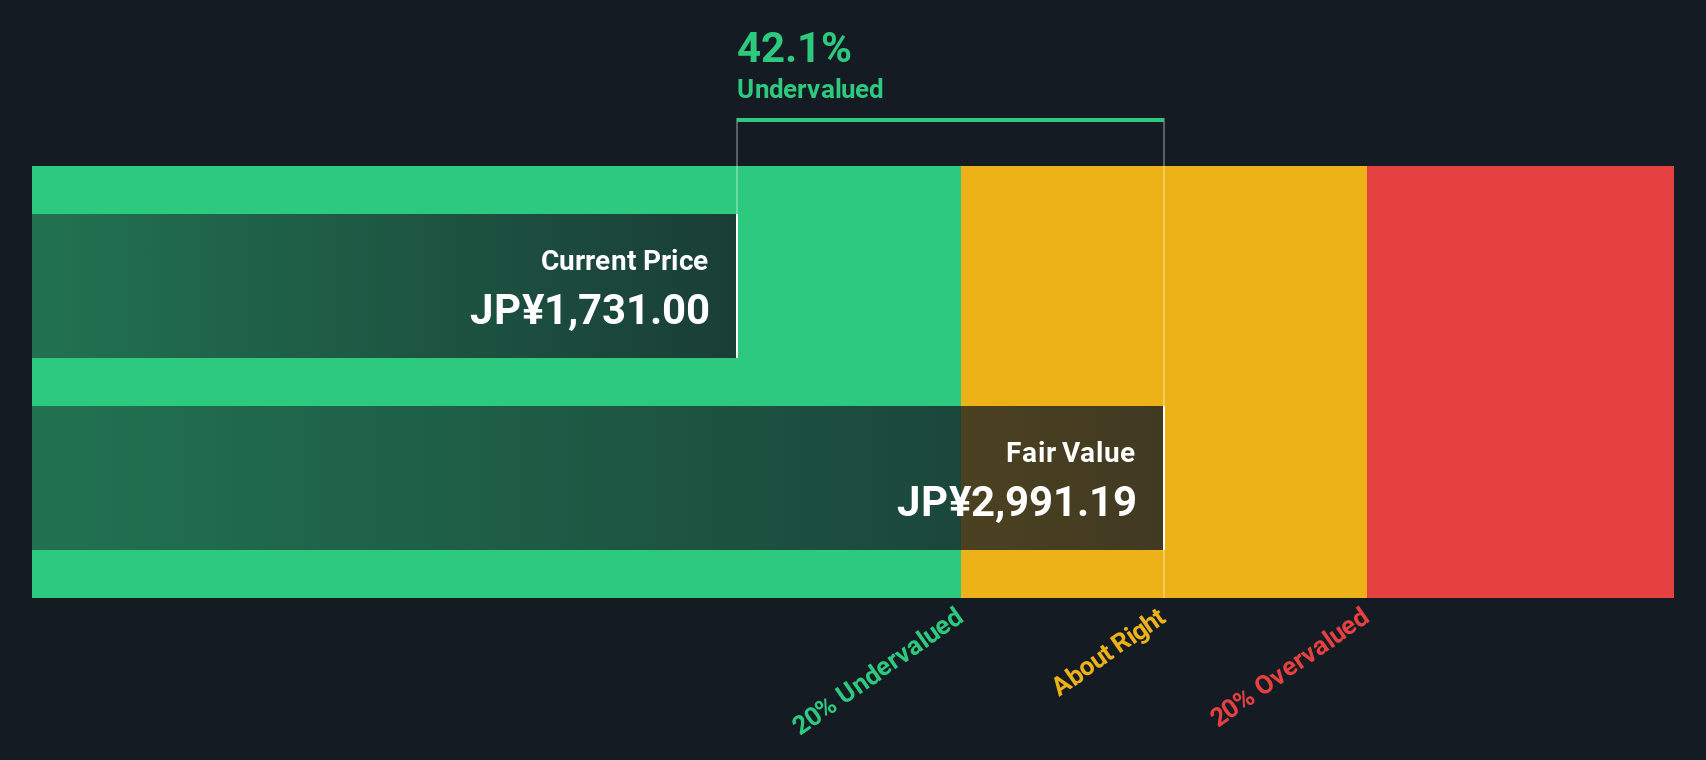
With the share price now at ¥1,731, the modest year to date share price return of 6.65% contrasts with a still negative three year total shareholder return of 22.39%. This suggests momentum is cautiously rebuilding as investors reassess risk and upside.
If this shift in sentiment has you thinking more broadly about opportunities in financials, it could be a good moment to explore fast growing stocks with high insider ownership as a source of fresh ideas.
With SBI Shinsei trading at a sizeable estimated intrinsic discount yet carrying a low value score, investors face a key dilemma: is this a mispriced restructuring story, or has the market already factored in its future recovery?
Price-to-Earnings of 18.2x: Is it justified?
On a last close of ¥1,731, SBI Shinsei Bank trades on a price-to-earnings ratio of 18.2 times, notably richer than both peer and industry averages.
The price-to-earnings multiple compares the current share price with the company earnings per share, making it a core yardstick for banks where profits and credit costs drive value. For SBI Shinsei, paying a higher multiple suggests investors are either baking in stronger earnings durability or are willing to overlook short-term noise in reported results.
Recent fundamentals help explain part of that premium, with earnings growing 45.9% over the past year against a 25.6% industry pace, and five-year earnings compounding at 12.1% per year. However, the presence of large one-off items and a Return on Equity of 8.8%, which is considered low, indicate the market could be overpaying for growth that is not yet matched by underlying profitability quality.
Set against the JP Banks industry average price-to-earnings ratio of 11.7 times and a peer group average of 12.4 times, SBI Shinsei valuation stands out as significantly more expensive. This gap may leave little margin of safety compared with sector alternatives if earnings do not improve in a more consistent, less one-off-driven way.
See what the numbers say about this price — find out in our valuation breakdown.
Result: Price-to-Earnings of 18.2x (OVERVALUED)
However, lingering questions around low returns and reliance on one off gains could quickly unwind sentiment if earnings momentum or asset quality disappoints.
Find out about the key risks to this SBI Shinsei Bank narrative.
Another View on Value
While the price to earnings ratio paints SBI Shinsei as expensive versus peers, our DCF model points the other way. It suggests the shares are trading about 42% below estimated fair value at roughly ¥3,000. Are investors overpaying for near term earnings, or underpricing the long game?
Look into how the SWS DCF model arrives at its fair value.
Simply Wall St performs a discounted cash flow (DCF) on every stock in the world every day (check out SBI Shinsei Bank for example). We show the entire calculation in full. You can track the result in your watchlist or portfolio and be alerted when this changes, or use our stock screener to discover 914 undervalued stocks based on their cash flows. If you save a screener we even alert you when new companies match - so you never miss a potential opportunity.
Build Your Own SBI Shinsei Bank Narrative
If you would rather weigh the numbers yourself and reach your own conclusions, you can easily build a personalized view in just a few minutes: Do it your way.
A great starting point for your SBI Shinsei Bank research is our analysis highlighting 2 key rewards and 3 important warning signs that could impact your investment decision.
Looking for more investment ideas?
Do not stop with a single bank thesis when the market is full of mispriced opportunities. Use the Simply Wall St Screener to keep your edge sharp.
- Capture potential bargains trading below their cash flow value by scanning these 914 undervalued stocks based on cash flows before the rest of the market catches on.
- Ride structural growth in automation and data by targeting innovators through these 25 AI penny stocks that are reshaping entire industries.
- Lock in reliable portfolio income by filtering for companies in these 13 dividend stocks with yields > 3% that offer yields above 3% with room to sustain payouts.
This article by Simply Wall St is general in nature. We provide commentary based on historical data and analyst forecasts only using an unbiased methodology and our articles are not intended to be financial advice. It does not constitute a recommendation to buy or sell any stock, and does not take account of your objectives, or your financial situation. We aim to bring you long-term focused analysis driven by fundamental data. Note that our analysis may not factor in the latest price-sensitive company announcements or qualitative material. Simply Wall St has no position in any stocks mentioned.
Have feedback on this article? Concerned about the content? Get in touch with us directly. Alternatively, email editorial-team@simplywallst.com