
 Nasdaq
 華爾街日報
華爾街日報Glory (TSE:6457): Assessing Valuation After Major Waitrose CI-100X Rollout Win
Glory (TSE:6457) just landed a sizable UK retail win, with Waitrose rolling out 285 CI-100X cash recycling units across its stores. For investors, this is a clear signal of competitive product traction.
See our latest analysis for Glory.
The Waitrose rollout fits neatly into a broader upswing, with Glory posting a roughly 56% year to date share price return and a powerful 3 year total shareholder return of about 109%. This suggests momentum is clearly building as the market reassesses its growth and risk profile.
If this kind of contract win has you thinking bigger about automation themes, it could be worth exploring fast growing stocks with high insider ownership as a way to uncover the next potential outperformers.
Yet with the shares now near analyst targets but still trading at a double digit discount to some intrinsic estimates, the key question is whether Glory remains a genuine buying opportunity or if markets are already pricing in its future growth.
Price to earnings of 18.4x: Is it justified?
On a price to earnings ratio of 18.4 times versus Glory's last close of ¥3990, the stock screens as richly valued against peers and the broader machinery space.
The price to earnings multiple compares the current share price to earnings per share, so for a cash handling equipment maker like Glory it is a shorthand for how much investors are willing to pay for each unit of its profit today. In this case, the market is assigning a premium tag, hinting that investors may be baking in a solid earnings recovery and steady long term demand for automation hardware.
However, that premium is hard to ignore when set against both direct peers and our own fair value yardstick. Glory trades at 18.4 times earnings compared with the peer group at 14.4 times and the Japanese machinery industry at 12.3 times, and even sits above our estimated fair price to earnings ratio of 17.4 times, a level the market could eventually gravitate toward if expectations cool.
Explore the SWS fair ratio for Glory
Result: Price to earnings of 18.4x (OVERVALUED)
However, sustained multiple expansion is not guaranteed if automation capex slows or if Glory struggles to translate recent revenue growth into consistently higher margins.
Find out about the key risks to this Glory narrative.
Another View: DCF Suggests Room for Upside
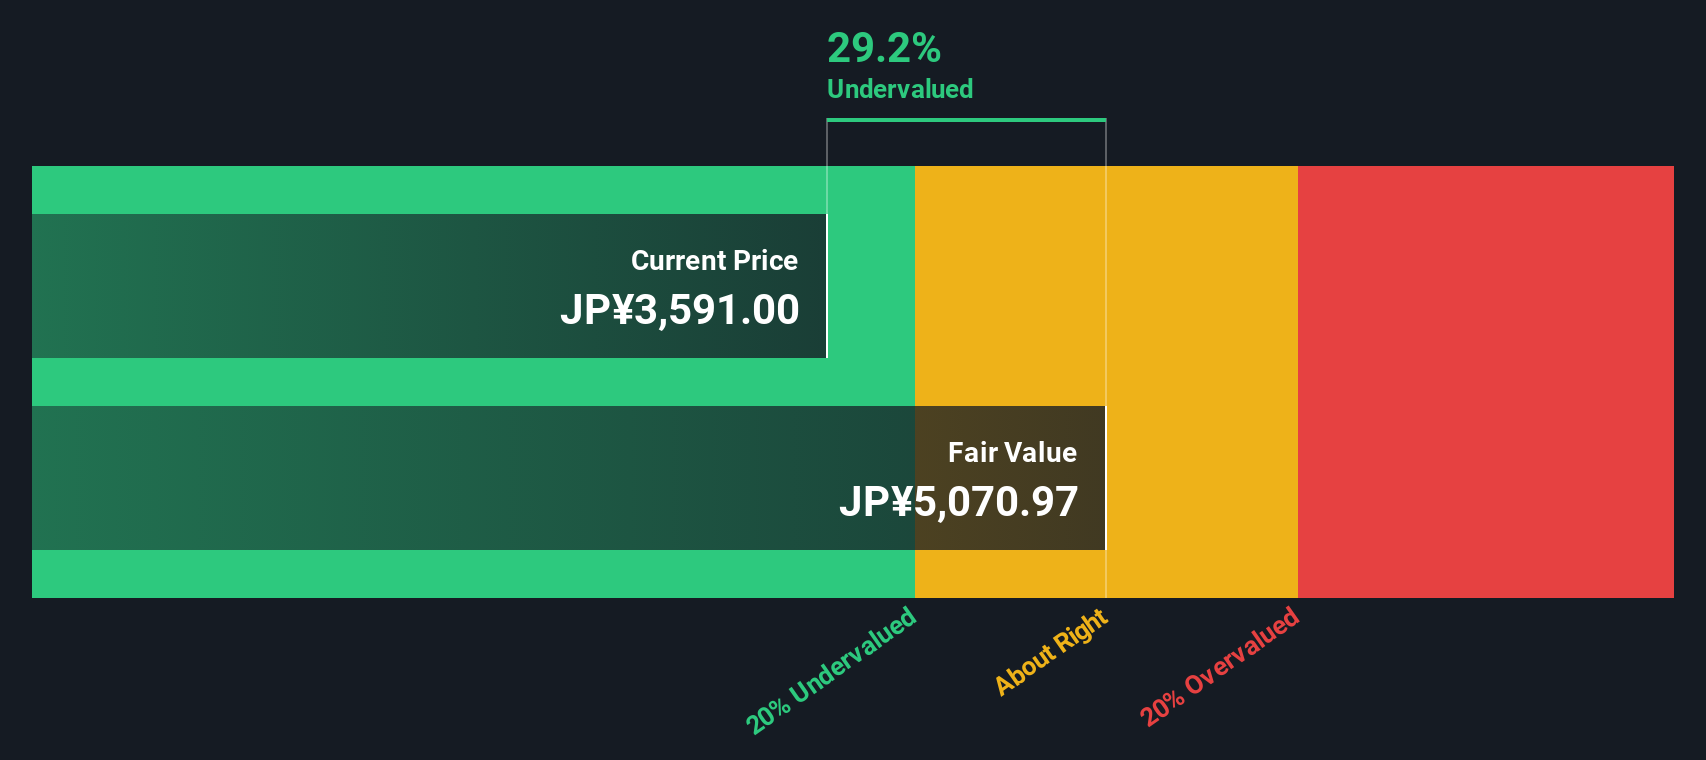
While the share price looks stretched on earnings, our DCF model presents a different picture, with Glory trading about 21% below an estimated fair value of roughly ¥5,072. If the cash flows play out as expected, is the market underestimating the long term story here?
Look into how the SWS DCF model arrives at its fair value.
Simply Wall St performs a discounted cash flow (DCF) on every stock in the world every day (check out Glory for example). We show the entire calculation in full. You can track the result in your watchlist or portfolio and be alerted when this changes, or use our stock screener to discover 918 undervalued stocks based on their cash flows. If you save a screener we even alert you when new companies match - so you never miss a potential opportunity.
Build Your Own Glory Narrative
If you see the data differently or want to stress test your own assumptions, you can build a fully custom view in just minutes. Do it your way.
A great starting point for your Glory research is our analysis highlighting 2 key rewards and 2 important warning signs that could impact your investment decision.
Looking for more investment ideas?
Do not stop with just one compelling story. Use the Simply Wall St Screener to uncover more targeted opportunities that could sharpen and strengthen your portfolio strategy.
- Capture potential value by scanning these 918 undervalued stocks based on cash flows that may be trading below what their future cash flows truly justify.
- Supercharge your growth watchlist by targeting these 25 AI penny stocks positioned at the forefront of artificial intelligence innovation.
- Lock in steadier income streams by focusing on these 13 dividend stocks with yields > 3% that can help anchor returns even when markets turn volatile.
This article by Simply Wall St is general in nature. We provide commentary based on historical data and analyst forecasts only using an unbiased methodology and our articles are not intended to be financial advice. It does not constitute a recommendation to buy or sell any stock, and does not take account of your objectives, or your financial situation. We aim to bring you long-term focused analysis driven by fundamental data. Note that our analysis may not factor in the latest price-sensitive company announcements or qualitative material. Simply Wall St has no position in any stocks mentioned.
Have feedback on this article? Concerned about the content? Get in touch with us directly. Alternatively, email editorial-team@simplywallst.com