
 Nasdaq
 華爾街日報
華爾街日報Has Occidental Petroleum’s 20% Slide in 2025 Created a Long Term Opportunity?
- Wondering if Occidental Petroleum is starting to look like a bargain, or if the market is still pricing in too much risk? Let us break down what the numbers are really saying about the stock.
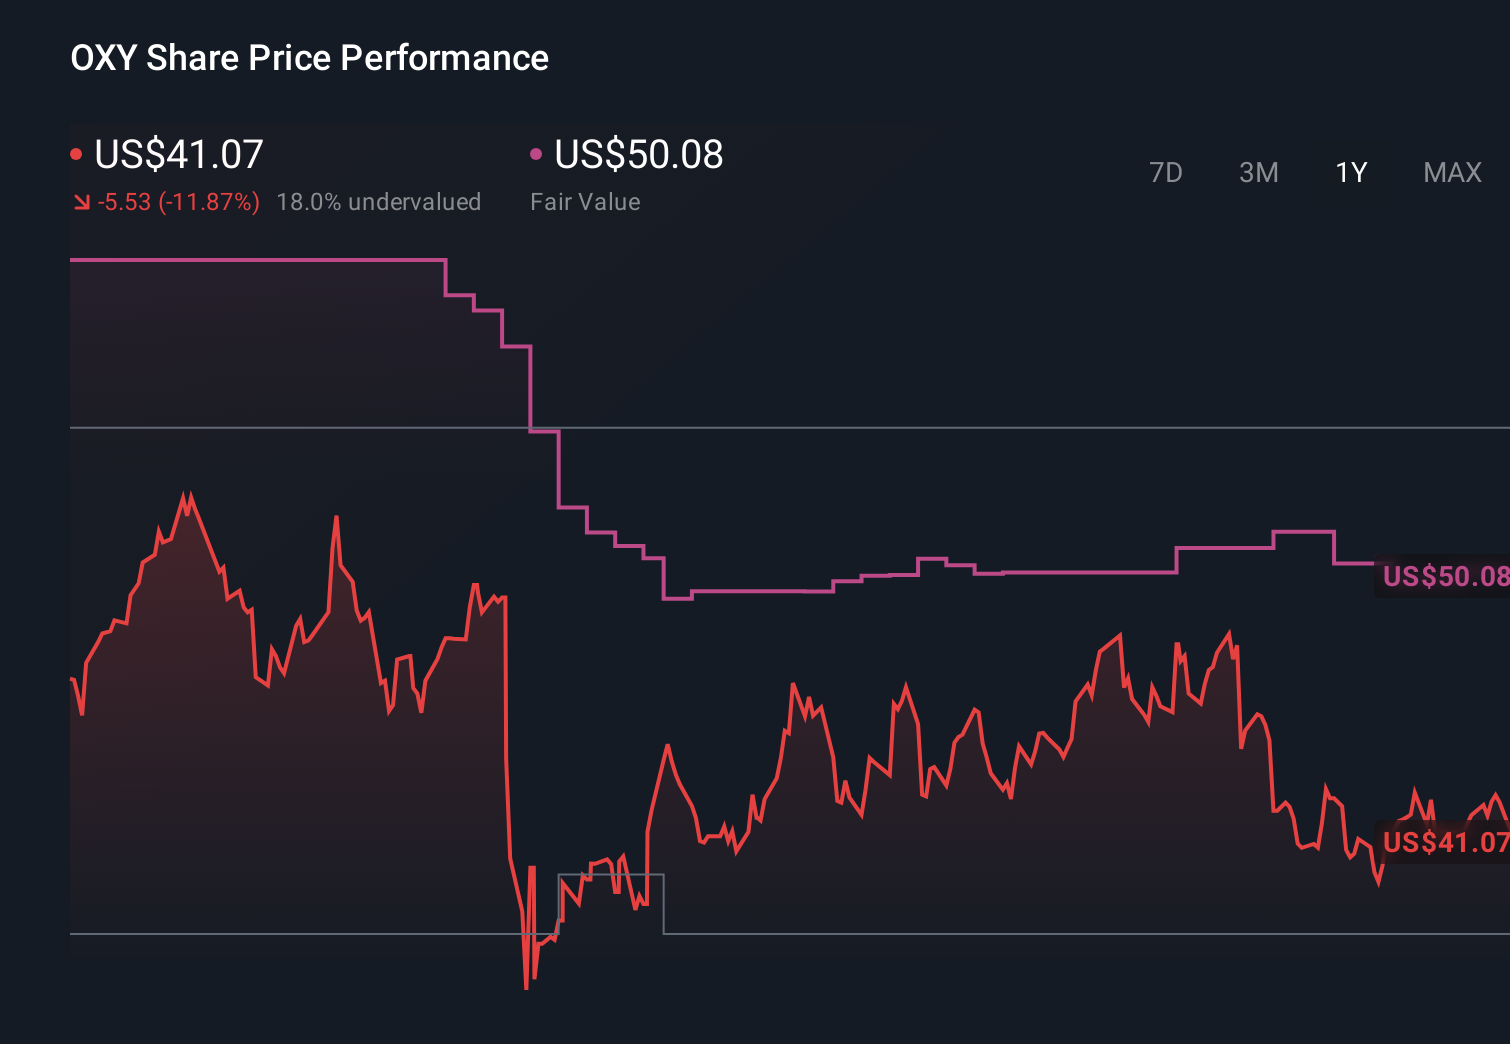
- Despite a strong 138.6% gain over the last 5 years, the share price has slipped lately, down 3.6% over the past week, 6.6% over the last month, and 20.2% year to date, leaving it about 10.5% lower than a year ago.
- These moves are unfolding against a backdrop of shifting energy demand expectations, ongoing debates about long term oil prices, and continued attention on capital discipline across the sector. Occidental has also stayed in the spotlight due to its balance sheet progress and strategic decisions around asset sales and low carbon initiatives. All of these factors feed into how investors are reassessing its risk and upside.
- Right now, Occidental scores just 2 out of 6 on our undervaluation checks. On the surface it may not look like a screaming value play, but the reality is more nuanced. We will walk through different valuation approaches next, and then finish with a more powerful way to think about the company’s true worth beyond any single metric.
Occidental Petroleum scores just 2/6 on our valuation checks. See what other red flags we found in the full valuation breakdown.
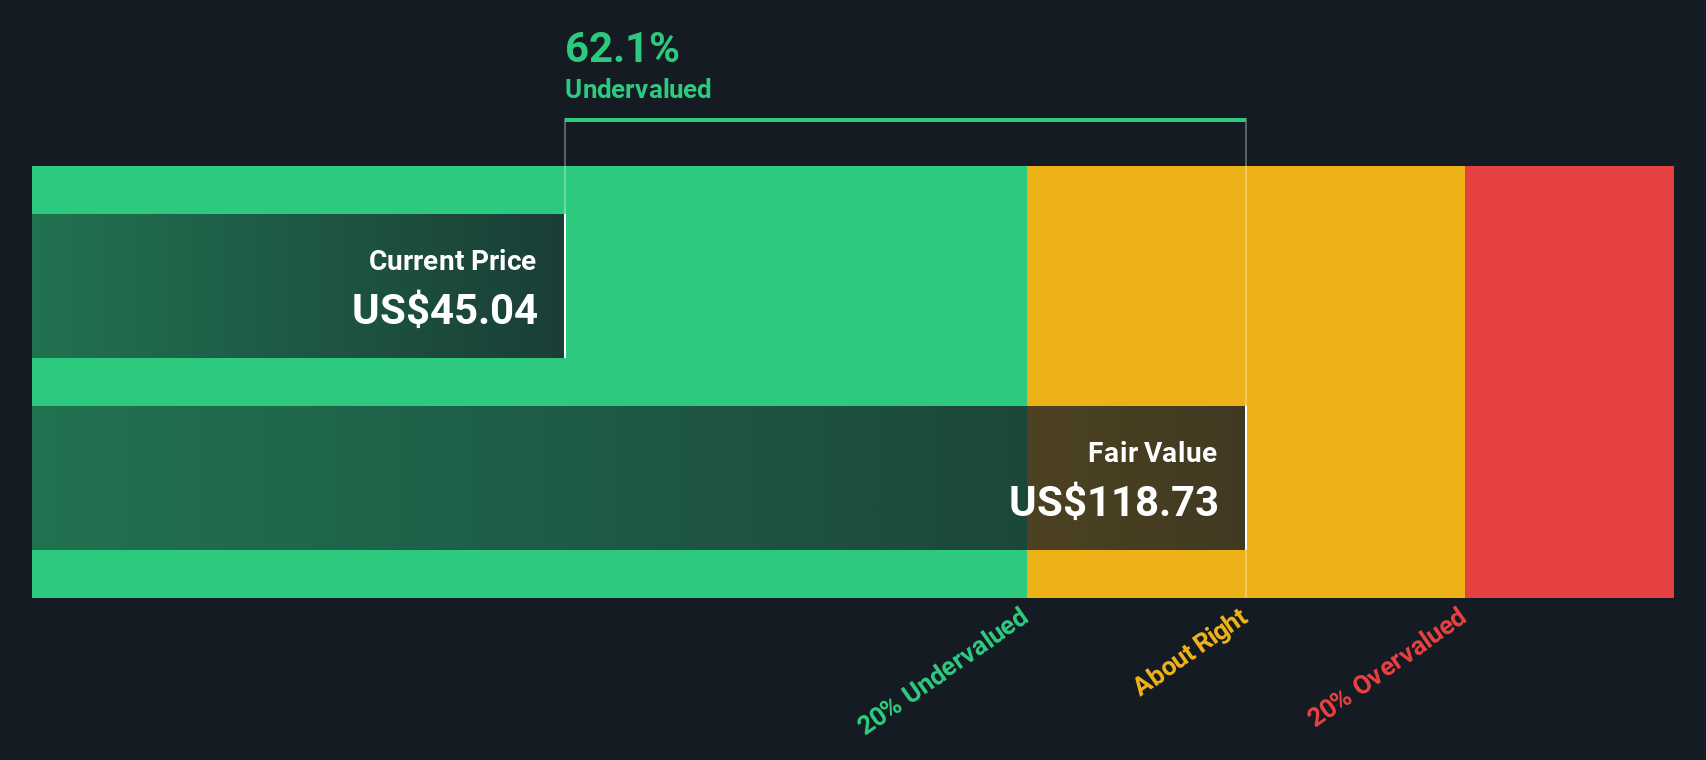
Approach 1: Occidental Petroleum Discounted Cash Flow (DCF) Analysis
A Discounted Cash Flow model projects a company’s future cash flows and then discounts them back into today’s dollars, aiming to estimate what the entire business is worth right now.
For Occidental Petroleum, the model uses last twelve month Free Cash Flow of about $4.4 billion and a 2 Stage Free Cash Flow to Equity framework. Analysts forecast FCF of roughly $6.6 billion by 2026, and Simply Wall St then extrapolates those cash flows further, with projections rising toward about $12.5 billion by 2035 as growth gradually tapers off.
When all those future cash flows are discounted back, the DCF model arrives at an estimated intrinsic value of about $236.57 per share. That comparison indicates the shares trade at roughly an 83.2% discount to this valuation, which suggests the market is pricing in far more risk, or much weaker long term cash generation, than the model assumes.
Result: UNDERVALUED
Our Discounted Cash Flow (DCF) analysis suggests Occidental Petroleum is undervalued by 83.2%. Track this in your watchlist or portfolio, or discover 918 more undervalued stocks based on cash flows.
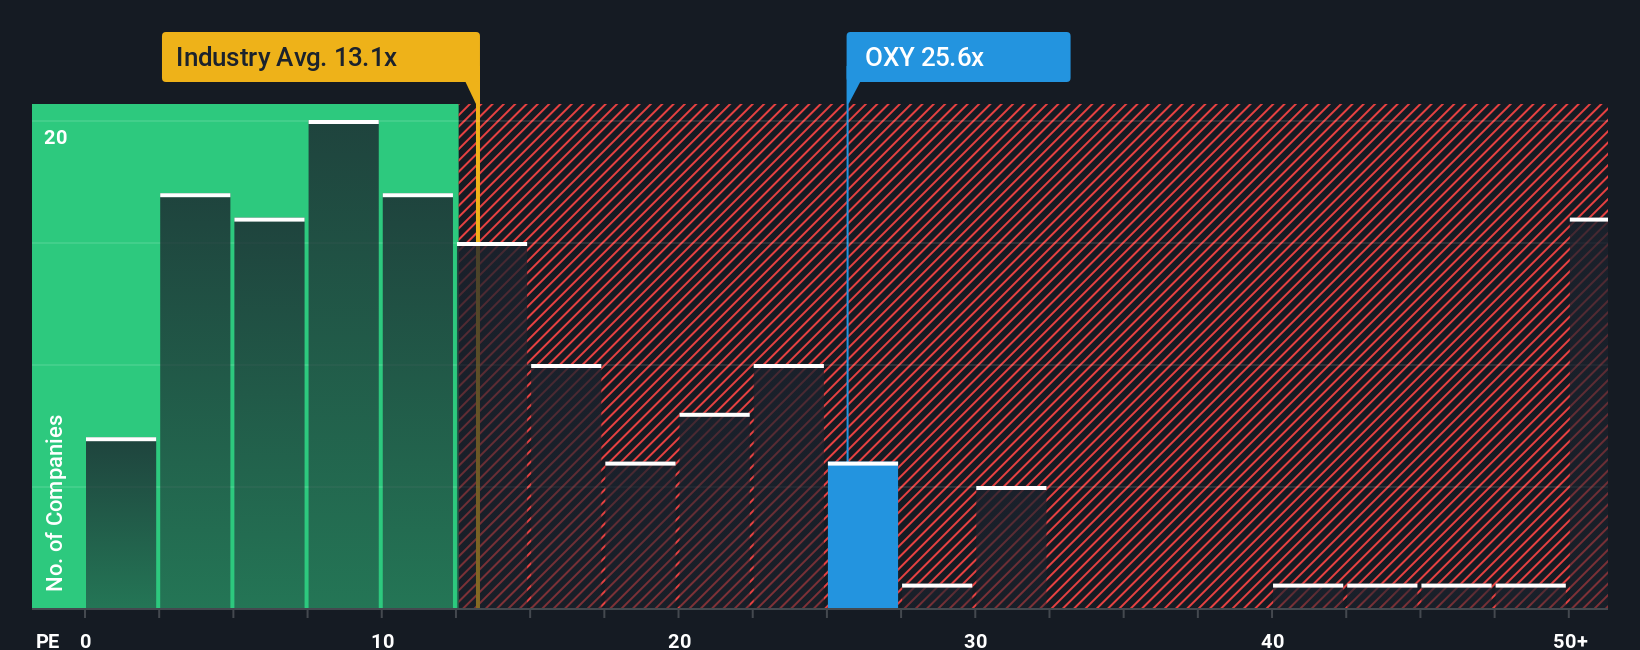
Approach 2: Occidental Petroleum Price vs Earnings
For profitable companies like Occidental Petroleum, the price to earnings multiple is a useful lens because it links what investors are paying directly to the earnings the business is already generating. In practice, a higher PE often reflects expectations of stronger growth or lower perceived risk, while a lower PE can signal slower growth, higher uncertainty, or a possible bargain if those fears are overdone.
Occidental currently trades on a PE of about 26.8x, which is higher than both the Oil and Gas industry average of roughly 13.0x and the broader peer group average of about 24.1x. At first glance, that premium might imply the market is already pricing in solid growth and improved balance sheet strength.
However, Simply Wall St’s Fair Ratio for Occidental is around 16.7x, a proprietary estimate of what a reasonable PE should be once you factor in the company’s earnings growth outlook, profitability, risk profile, industry positioning, and market cap. This Fair Ratio is more tailored than a simple industry or peer comparison, because it adjusts for Occidental’s specific strengths and vulnerabilities rather than assuming they match the average oil and gas stock. With the actual PE of 26.8x sitting well above the 16.7x Fair Ratio, the multiple suggests the shares look overvalued on this basis.
Result: OVERVALUED
PE ratios tell one story, but what if the real opportunity lies elsewhere? Discover 1466 companies where insiders are betting big on explosive growth.
Upgrade Your Decision Making: Choose your Occidental Petroleum Narrative
Earlier we mentioned that there is an even better way to understand valuation, so let us introduce you to Narratives, a simple way to turn your view of Occidental into a structured story that links what you believe about its future revenue, earnings and margins to a concrete financial forecast and fair value estimate. On Simply Wall St’s Community page, millions of investors use Narratives to say, in plain language, why they think a company will win or struggle, then back that story with their own assumptions that drive a fair value they can compare to today’s share price to decide whether to buy, hold, or sell. Because Narratives on the platform are updated dynamically as new information like earnings, news and guidance comes in, they stay aligned with reality rather than a one off snapshot. For Occidental, one investor Narrative might lean into strong cash flows, successful carbon capture and multiple expansion to reach a fair value in the mid 60s. Another more cautious Narrative could highlight oil price risk, execution uncertainty in CCS and sector headwinds to arrive at a fair value closer to the low 40s.
Do you think there's more to the story for Occidental Petroleum? Head over to our Community to see what others are saying!
This article by Simply Wall St is general in nature. We provide commentary based on historical data and analyst forecasts only using an unbiased methodology and our articles are not intended to be financial advice. It does not constitute a recommendation to buy or sell any stock, and does not take account of your objectives, or your financial situation. We aim to bring you long-term focused analysis driven by fundamental data. Note that our analysis may not factor in the latest price-sensitive company announcements or qualitative material. Simply Wall St has no position in any stocks mentioned.
Have feedback on this article? Concerned about the content? Get in touch with us directly. Alternatively, email editorial-team@simplywallst.com