
 Nasdaq
 華爾街日報
華爾街日報Has Twilio’s Recent Rally Already Priced In Its Profitability Push?
- If you are wondering whether Twilio is still a bargain after its recent run, or if the easier opportunities may already have passed, this is a good place to unpack what the current price really implies.
- The stock has climbed 4.5% over the last week, 15.6% in the past month, and is now up 27.3% year to date and 28.7% over the last year, even after a volatile 5‑year journey in which it remains 61.7% below its peak.
- Recently, Twilio has been in the spotlight for sharpening its focus on higher‑margin software and customer engagement tools, while continuing to streamline less profitable parts of the business. Investors have also responded to management emphasizing profitability and efficiency, which helps explain why sentiment around the stock has improved.
- On our framework, Twilio scores just 2/6 on valuation checks, suggesting the market may already be pricing in a lot of potential upside, but not necessarily in a consistent way across metrics. Next, we will break down different valuation approaches to see where the gaps really are, before finishing with a more holistic way to think about what Twilio might be worth.
Twilio scores just 2/6 on our valuation checks. See what other red flags we found in the full valuation breakdown.
Approach 1: Twilio Discounted Cash Flow (DCF) Analysis
A Discounted Cash Flow model estimates what a company is worth today by projecting its future cash flows and discounting them back to present value. For Twilio, this involves taking expected Free Cash Flow in $ over the coming years and applying a required return to reflect risk and the time value of money.
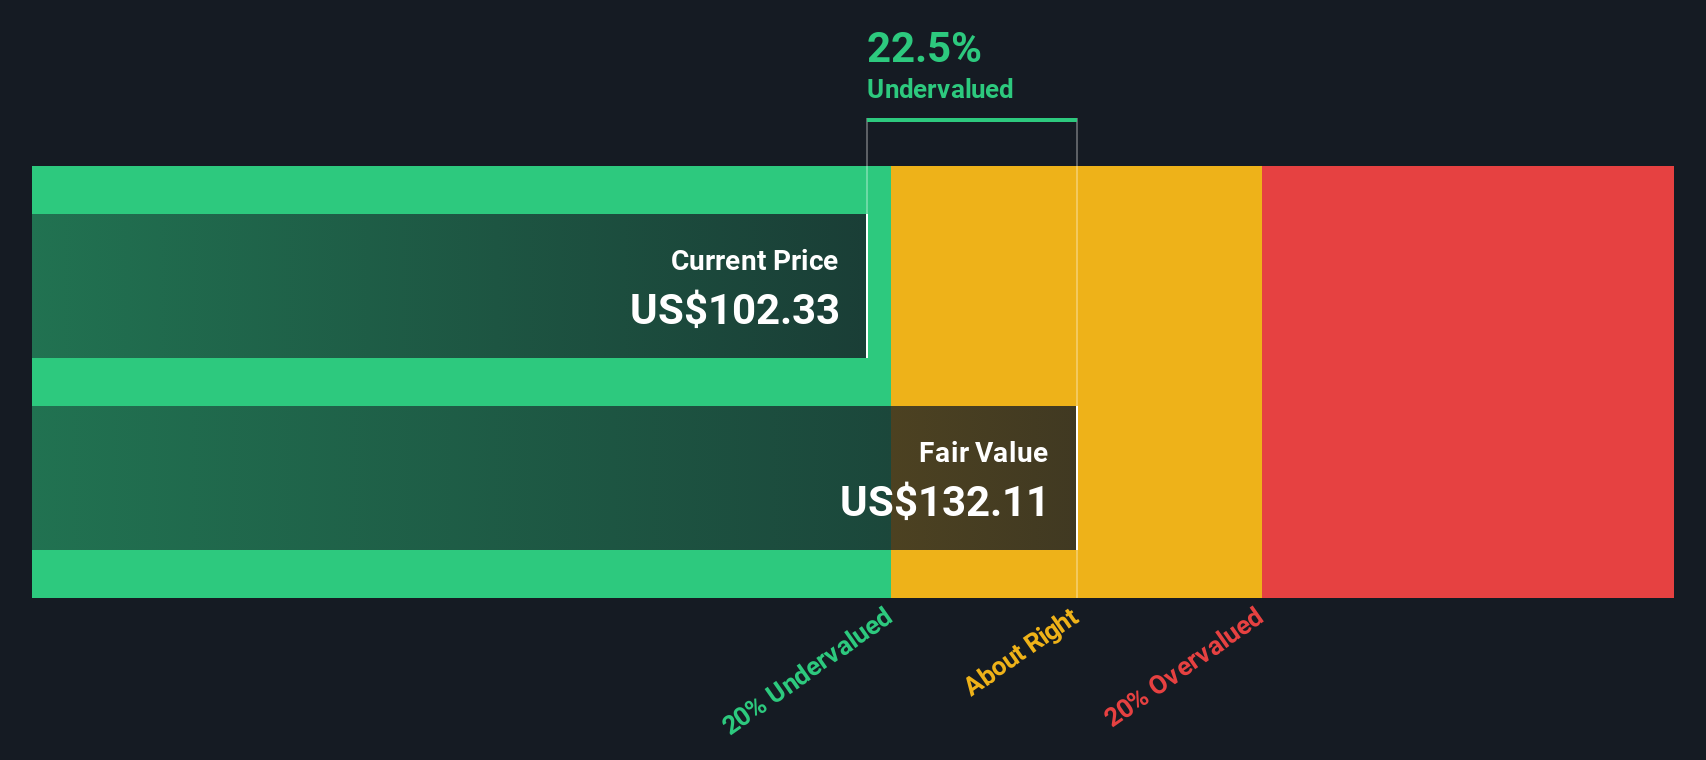
Twilio generated about $778 million in Free Cash Flow over the last twelve months. Analysts see this rising steadily, with Simply Wall St blending analyst forecasts and longer term extrapolations to reach projected Free Cash Flow of around $1.39 billion by 2035. These cash flows, along with a terminal value, are discounted using a 2 Stage Free Cash Flow to Equity model to arrive at an intrinsic value of roughly $119.57 per share.
Compared with the current share price, this DCF output suggests Twilio is about 16.2% overvalued, implying that much of the expected cash flow improvement is already reflected in the stock.
Result: OVERVALUED
Our Discounted Cash Flow (DCF) analysis suggests Twilio may be overvalued by 16.2%. Discover 918 undervalued stocks or create your own screener to find better value opportunities.
Approach 2: Twilio Price vs Sales
For growing software and communications platforms like Twilio that are still normalizing profitability, the Price to Sales multiple is often a more stable yardstick than earnings based metrics, since revenue is less affected by one off costs and margin volatility. Investors typically accept a higher P/S for companies with stronger growth prospects and lower risk, while slower or riskier businesses tend to trade at lower multiples.
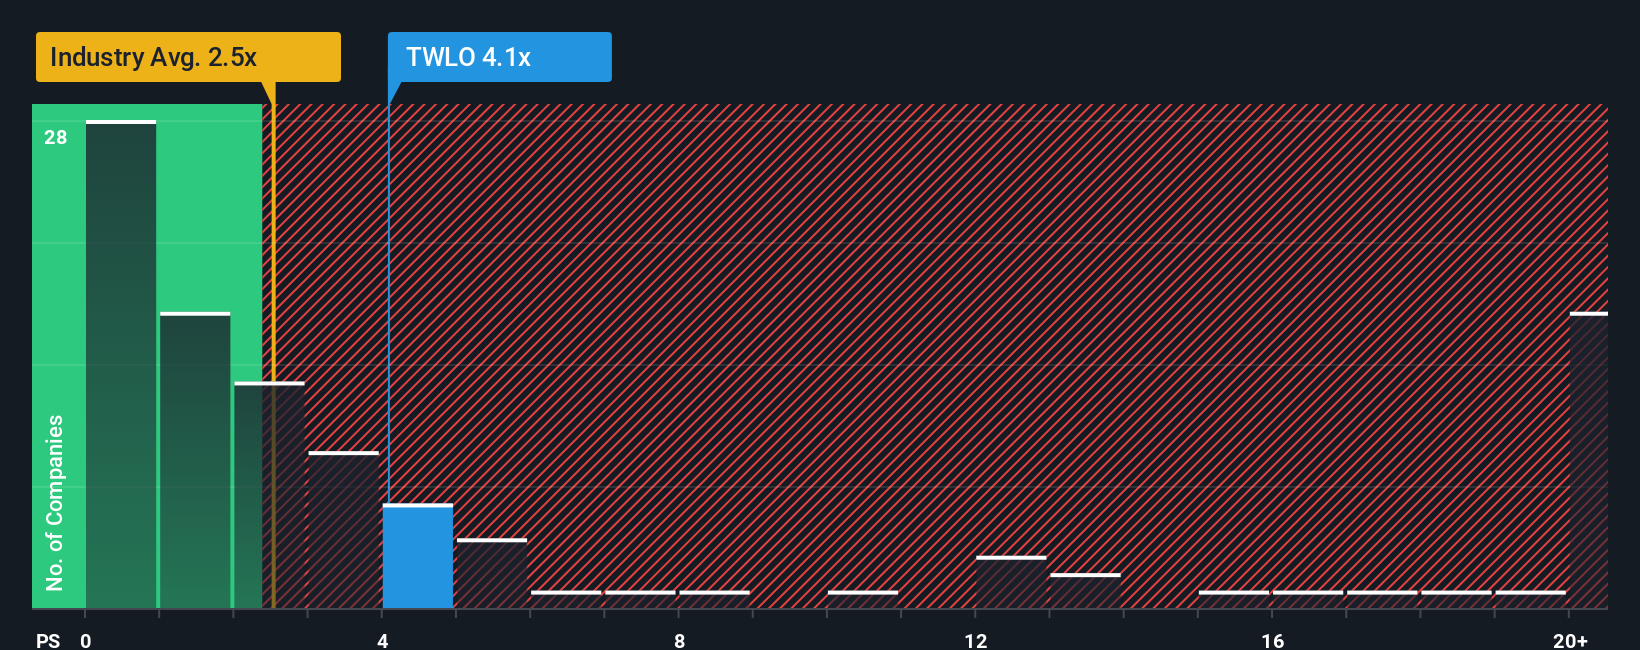
Twilio currently trades at about 4.30x sales, compared with an IT industry average of roughly 2.27x and a peer group average of around 6.54x. Simply Wall St’s Fair Ratio for Twilio, at 4.79x, represents the P/S multiple the company might reasonably command given its growth outlook, margins, scale and risk profile. This is more informative than a simple peer or sector comparison, because it adjusts for Twilio’s specific fundamentals rather than assuming it should trade like the “average” software stock.
With the market pricing Twilio at 4.30x versus a Fair Ratio of 4.79x, the stock appears slightly undervalued on this framework.
Result: UNDERVALUED
PS ratios tell one story, but what if the real opportunity lies elsewhere? Discover 1460 companies where insiders are betting big on explosive growth.
Upgrade Your Decision Making: Choose your Twilio Narrative
Earlier we mentioned that there is an even better way to understand valuation, so let us introduce you to Narratives, a simple way to connect your view of Twilio’s story with the numbers behind its future revenue, earnings, margins and ultimately its fair value. A Narrative is your investment story translated into a financial forecast, then into a fair value estimate, so you can clearly see how assumptions about Twilio’s growth, profitability and risk flow through to what you think the shares are worth. On Simply Wall St, Narratives are available on the Community page and are designed to be easy to use, helping millions of investors decide when to buy or sell by comparing their Fair Value to the current Price and seeing the implied upside or downside. These Narratives update dynamically as new information, such as earnings or major news, comes in so your thesis stays current rather than static. For example, one Twilio Narrative on the platform might see fair value around $68, while another sees closer to $138, reflecting how different investors can look at the same company and reach very different, but clearly quantified, conclusions.
Do you think there's more to the story for Twilio? Head over to our Community to see what others are saying!

This article by Simply Wall St is general in nature. We provide commentary based on historical data and analyst forecasts only using an unbiased methodology and our articles are not intended to be financial advice. It does not constitute a recommendation to buy or sell any stock, and does not take account of your objectives, or your financial situation. We aim to bring you long-term focused analysis driven by fundamental data. Note that our analysis may not factor in the latest price-sensitive company announcements or qualitative material. Simply Wall St has no position in any stocks mentioned.
Have feedback on this article? Concerned about the content? Get in touch with us directly. Alternatively, email editorial-team@simplywallst.com