
 Nasdaq
 華爾街日報
華爾街日報Jefferies Financial Group (JEF) Valuation Check After Upbeat Oppenheimer and UBS Growth Outlooks
Jefferies Financial Group (JEF) is back in the spotlight after upbeat research from Oppenheimer and UBS, as both houses lean into a friendlier backdrop for mergers, underwriting and broader financial earnings.
See our latest analysis for Jefferies Financial Group.
That constructive backdrop is starting to show up in the tape, with a roughly 13% 1 month share price return off a subdued year to date performance. At the same time, Jefferies longer term total shareholder returns north of 100% over three years suggest momentum is rebuilding rather than breaking.
If Jefferies renewed deal appetite has your attention, this could be a good moment to explore other financial names with compelling insider alignment using fast growing stocks with high insider ownership.
With shares still trading at a discount to consensus targets despite a powerful three year run and improving deal flow, the key question now is whether Jefferies remains undervalued or if markets are already baking in the next leg of growth.
Price-to-Earnings of 19.9x: Is it justified?
Jefferies trades on a 19.9 times price to earnings multiple, sitting slightly below close peers but a touch above its own estimated fair valuation level.
The price to earnings ratio measures how much investors are willing to pay today for a dollar of current earnings and is a core yardstick for capital markets firms where profitability can swing with deal volumes. For Jefferies, that multiple embeds expectations that the recent recovery in earnings is at least partly sustainable rather than a one off rebound.
Against the broader US Capital Markets industry, Jefferies looks modestly cheap on this metric. Its 19.9 times price to earnings is below the sector average of 25.3 times, suggesting investors are not fully crediting its recent 21.3 percent earnings growth or its stronger-than-industry profit momentum. However, when measured against the estimated fair price to earnings ratio of 18.4 times, the stock appears a shade expensive. This implies the market may already be paying a small premium to that regression based fair ratio that could narrow if sentiment cools.
Explore the SWS fair ratio for Jefferies Financial Group
Result: Price-to-Earnings of 19.9x (ABOUT RIGHT)
However, Jefferies remains vulnerable to a sudden slowdown in capital markets activity and to any misstep on deal underwriting that pressures margins and earnings momentum.
Find out about the key risks to this Jefferies Financial Group narrative.
Another Angle on Value
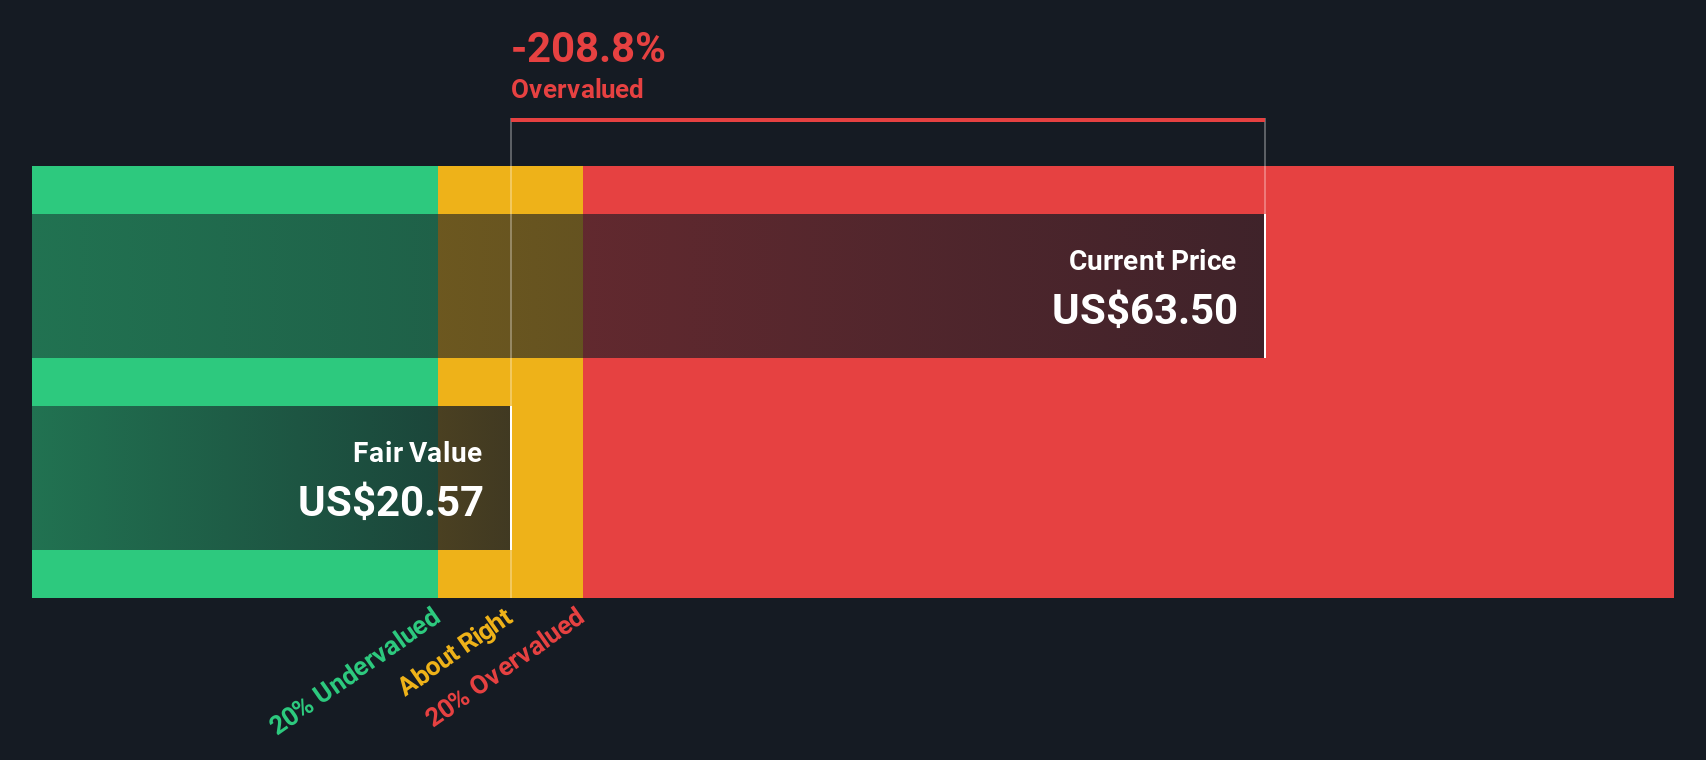
Our SWS DCF model paints a less generous picture, putting fair value for Jefferies closer to $50.68 versus the current $61.90 share price. This suggests the stock is trading rich rather than cheap. Is this just optimism about the cycle, or a warning not to chase the rally?
Look into how the SWS DCF model arrives at its fair value.
Simply Wall St performs a discounted cash flow (DCF) on every stock in the world every day (check out Jefferies Financial Group for example). We show the entire calculation in full. You can track the result in your watchlist or portfolio and be alerted when this changes, or use our stock screener to discover 916 undervalued stocks based on their cash flows. If you save a screener we even alert you when new companies match - so you never miss a potential opportunity.
Build Your Own Jefferies Financial Group Narrative
If you see the story differently or would rather rely on your own analysis, you can build a personalised view in just a few minutes: Do it your way.
A great starting point for your Jefferies Financial Group research is our analysis highlighting 3 key rewards and 1 important warning sign that could impact your investment decision.
Ready for more investment ideas?
If Jefferies has sparked your interest, do not stop here, use the Simply Wall St Screener to uncover fresh opportunities that match your strategy today.
- Capture potential market mispricings by targeting companies that may be trading below their intrinsic value through these 916 undervalued stocks based on cash flows.
- Tap into cutting edge innovation by focusing on businesses riding the next wave of intelligent automation with these 24 AI penny stocks.
- Strengthen your income strategy by pinpointing reliable payers using these 13 dividend stocks with yields > 3% to seek yields that stand out from the market.
This article by Simply Wall St is general in nature. We provide commentary based on historical data and analyst forecasts only using an unbiased methodology and our articles are not intended to be financial advice. It does not constitute a recommendation to buy or sell any stock, and does not take account of your objectives, or your financial situation. We aim to bring you long-term focused analysis driven by fundamental data. Note that our analysis may not factor in the latest price-sensitive company announcements or qualitative material. Simply Wall St has no position in any stocks mentioned.
Have feedback on this article? Concerned about the content? Get in touch with us directly. Alternatively, email editorial-team@simplywallst.com