
 Nasdaq
 華爾街日報
華爾街日報Assessing Toho Holdings (TSE:8129) Valuation After 3D Investment Partners’ Governance Litigation Push
A major shareholder has just pushed Toho Holdings (TSE:8129) into the spotlight, with 3D Investment Partners openly urging the company’s outside directors to pursue litigation over management’s past legal responsibilities.
See our latest analysis for Toho Holdings.
The governance push comes after a choppy few months, with a 90 day share price return of minus 14.23 percent, but a solid year to date share price gain of 9.12 percent and a standout 3 year total shareholder return of 126.10 percent. This suggests that long term momentum remains intact even as investors reassess governance risk.
If this governance shake up has you rethinking healthcare exposure, it is a good moment to explore healthcare stocks for other potential opportunities in the sector.
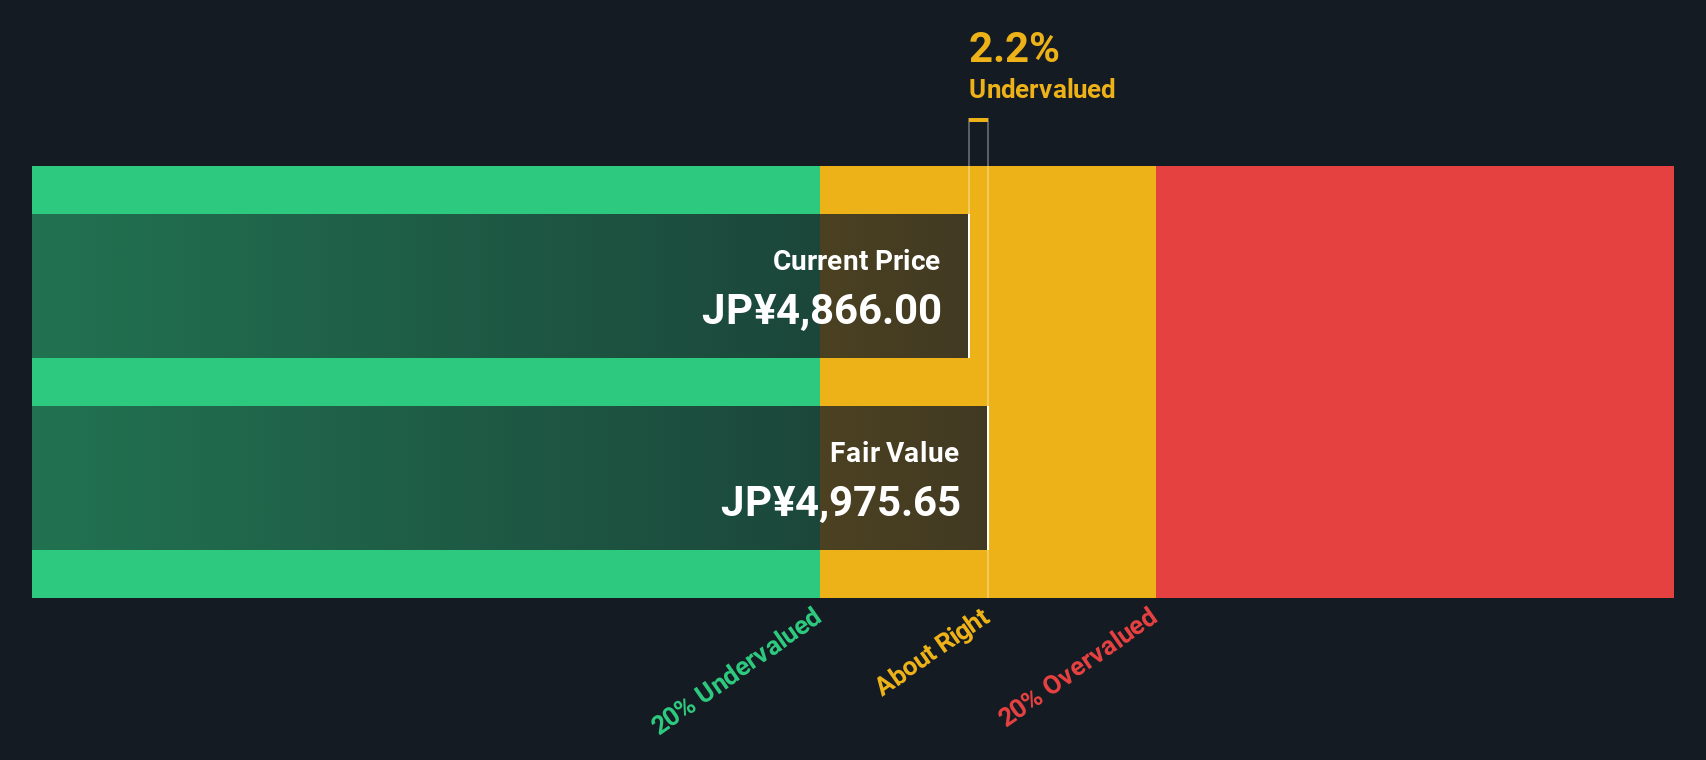
With the stock trading at a modest discount to analyst targets but a hefty implied intrinsic discount, does this governance turmoil hint at an undervalued healthcare distributor, or has the market already priced in Toho’s next leg of growth?
Price-to-Earnings of 14.8x: Is it justified?
Using a price-to-earnings ratio as the lens, Toho Holdings current share price of ¥4727 screens as attractively valued against both peers and broader healthcare names.
The price to earnings multiple compares what investors are paying today for each unit of current earnings, a crucial yardstick in steady, profit generating distributors like Toho. When that earnings based valuation sits below comparable companies, it often implies the market is not fully crediting the company for its current profitability or its ability to sustain it.
Here, Toho trades on a 14.8 times price to earnings ratio, lower than the Japanese healthcare industry average of 15.6 times and below the 17.1 times peer average, a clear relative discount. Our analysis also suggests an estimated fair price to earnings ratio of 18.6 times, indicating meaningful room for the market multiple to converge upward if earnings delivery continues.
Explore the SWS fair ratio for Toho Holdings
Result: Price-to-Earnings of 14.8x (UNDERVALUED)
However, governance uncertainty and slowing earnings growth could pressure the valuation, especially if legal disputes escalate or if reimbursement dynamics weaken healthcare distributor margins.
Find out about the key risks to this Toho Holdings narrative.
Another View on Value
Our DCF model presents a much stronger upside case, with Toho Holdings trading about 44.6 percent below an estimated fair value of roughly ¥8532. That is a far larger gap than the modest discount implied by earnings multiples. This raises the question: is this a mispricing, or a signal that cash flow assumptions are too optimistic?
Look into how the SWS DCF model arrives at its fair value.
Simply Wall St performs a discounted cash flow (DCF) on every stock in the world every day (check out Toho Holdings for example). We show the entire calculation in full. You can track the result in your watchlist or portfolio and be alerted when this changes, or use our stock screener to discover 916 undervalued stocks based on their cash flows. If you save a screener we even alert you when new companies match - so you never miss a potential opportunity.
Build Your Own Toho Holdings Narrative
If you would rather challenge these assumptions and dig into the numbers yourself, you can build a personalized view in minutes: Do it your way.
A great starting point for your Toho Holdings research is our analysis highlighting 4 key rewards and 2 important warning signs that could impact your investment decision.
Looking for more investment ideas?
Before you move on, consider scanning focused stock shortlists on Simply Wall Street’s Screener so you can review a broader range of potential opportunities.
- Explore beaten down opportunities with these 916 undervalued stocks based on cash flows that show strong cash flow potential and attractive entry prices.
- Target innovation trends with these 24 AI penny stocks positioned to benefit from demand for intelligent automation and data driven products.
- Review potential income streams through these 13 dividend stocks with yields > 3% that aim to balance yield with sustainable payout potential.
This article by Simply Wall St is general in nature. We provide commentary based on historical data and analyst forecasts only using an unbiased methodology and our articles are not intended to be financial advice. It does not constitute a recommendation to buy or sell any stock, and does not take account of your objectives, or your financial situation. We aim to bring you long-term focused analysis driven by fundamental data. Note that our analysis may not factor in the latest price-sensitive company announcements or qualitative material. Simply Wall St has no position in any stocks mentioned.
Have feedback on this article? Concerned about the content? Get in touch with us directly. Alternatively, email editorial-team@simplywallst.com