
 Nasdaq
 華爾街日報
華爾街日報Theon International (ENXTAM:THEON) Valuation Check After Strong 1-Year Rally and Recent Share Price Pullback
Theon International (ENXTAM:THEON) has quietly delivered strong gains over the past year, even as recent weeks turned choppy. That mix of momentum and pullback is exactly what makes the stock interesting now.
See our latest analysis for Theon International.
At a latest share price of $27.45, Theon International has cooled off from its sharp run, with a 7 day share price return of minus 9.11 percent and a 1 year total shareholder return of 131 percent. This still points to strong underlying momentum and a market steadily repricing its growth and defence exposure.
If Theon’s surge has you rethinking where growth and resilience might come from next, it is worth scanning aerospace and defense stocks for other names the market could be warming up to.
With earnings still growing fast and the share price retreating from recent highs, Theon now trades at a notable discount to analyst targets. The question for investors is whether this presents a genuine buying opportunity or whether the market is already pricing in future growth.
Price to earnings of 26.4x: Is it justified?
Theon International trades on a price to earnings ratio of 26.4 times, above peer averages, at a last close of €27.45. This tilts the current valuation toward the expensive side relative to many comparables.
The price to earnings multiple compares what investors are paying for each euro of current earnings. It is a direct gauge of how the market values Theon’s profit engine in the capital intensive aerospace and defence space. At 26.4 times earnings, investors are effectively assuming robust profit growth and durability in defence spending, and they are paying more for each euro of profit than the average peer group on a simple comparison.
Against the European aerospace and defence industry, however, Theon’s 26.4 times sits below the 29 times industry average. This suggests the market is not assigning it a premium position within its sector despite strong growth and high returns. Compared with an estimated fair price to earnings ratio of 23.8 times, there is also a gap that the market could move toward if sentiment or growth expectations cool, meaning some compression in the multiple cannot be ruled out.
Explore the SWS fair ratio for Theon International
Result: Price to earnings of 26.4x (OVERVALUED)
However, risks remain, including potential slowdowns in defence spending and contract delays, which could put pressure on Theon’s high growth expectations and lofty valuation.
Find out about the key risks to this Theon International narrative.
Another view on value
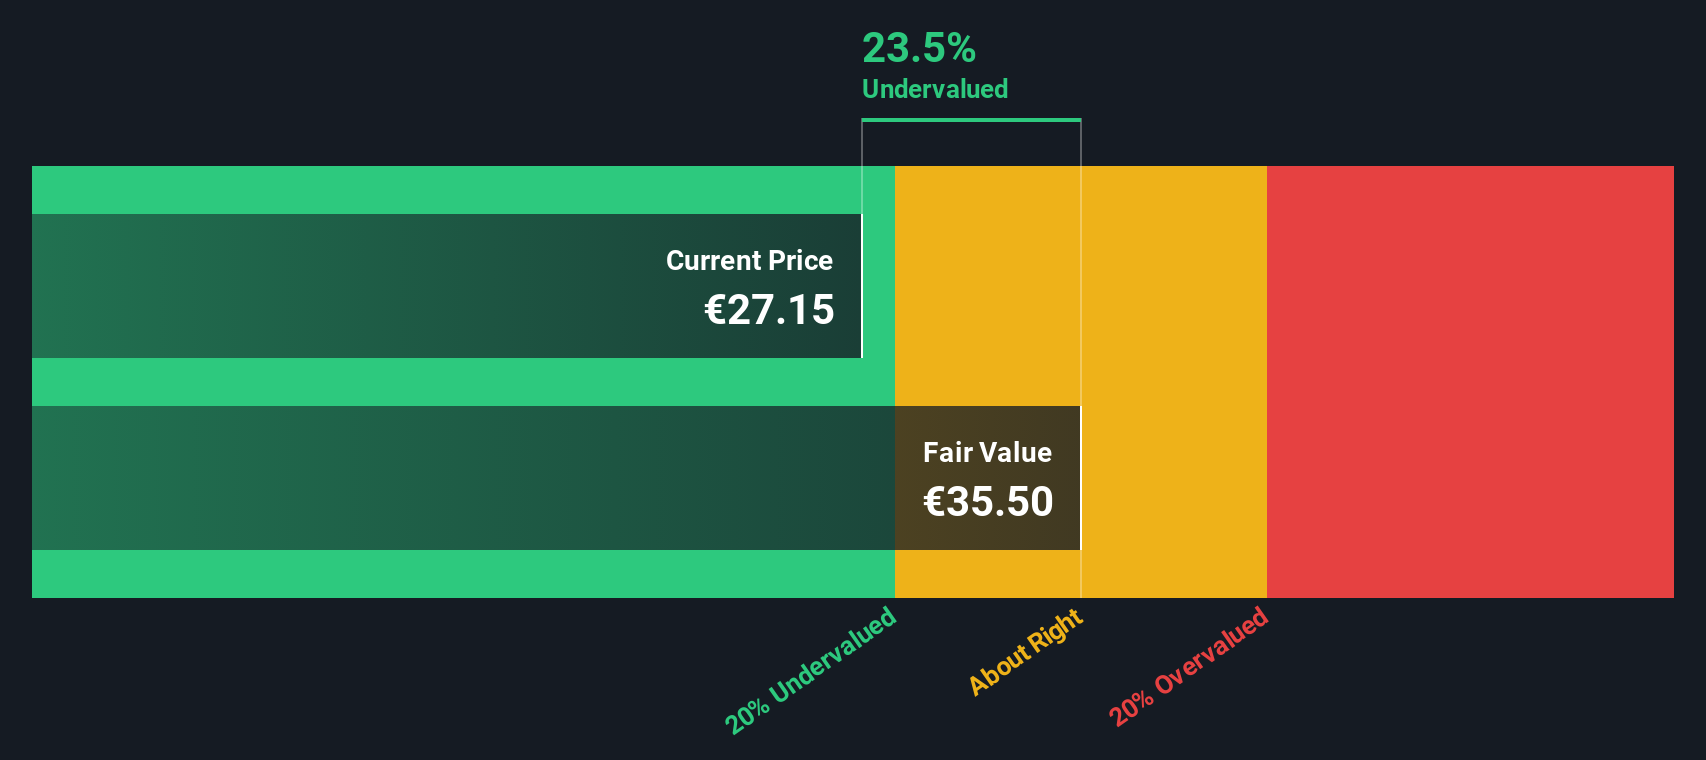
Our DCF model paints a softer picture than the punchy 26.4 times earnings multiple. On that lens, Theon trades about 12.5 percent below our estimate of fair value, which suggests some potential upside if growth forecasts hold. Is this just a margin of safety or a value trap in disguise?
Look into how the SWS DCF model arrives at its fair value.
Simply Wall St performs a discounted cash flow (DCF) on every stock in the world every day (check out Theon International for example). We show the entire calculation in full. You can track the result in your watchlist or portfolio and be alerted when this changes, or use our stock screener to discover 916 undervalued stocks based on their cash flows. If you save a screener we even alert you when new companies match - so you never miss a potential opportunity.
Build Your Own Theon International Narrative
If you see the story differently or want to dig into the numbers yourself, you can build a personalised view in just minutes. Do it your way
A great starting point for your Theon International research is our analysis highlighting 4 key rewards and 2 important warning signs that could impact your investment decision.
Ready for your next investing move?
Before the market sets the pace without you, put Simply Wall Street’s Screener to work and line up your next wave of high conviction ideas today.
- Capture potential mispricings early by targeting these 916 undervalued stocks based on cash flows that the market has not fully recognised yet.
- Position yourself for innovation led growth by focusing on these 24 AI penny stocks shaping the next generation of intelligent technologies.
- Lock in upfront income potential by zeroing in on these 13 dividend stocks with yields > 3% that can strengthen your portfolio’s cash flow.
This article by Simply Wall St is general in nature. We provide commentary based on historical data and analyst forecasts only using an unbiased methodology and our articles are not intended to be financial advice. It does not constitute a recommendation to buy or sell any stock, and does not take account of your objectives, or your financial situation. We aim to bring you long-term focused analysis driven by fundamental data. Note that our analysis may not factor in the latest price-sensitive company announcements or qualitative material. Simply Wall St has no position in any stocks mentioned.
Have feedback on this article? Concerned about the content? Get in touch with us directly. Alternatively, email editorial-team@simplywallst.com