
 Nasdaq
 華爾街日報
華爾街日報Can Goldman Sachs Still Reward Investors After Its 52% Surge in 2025?
- If you are wondering whether Goldman Sachs Group is still worth buying after this huge run, you are not alone. This is exactly the kind of stock where valuation really matters.
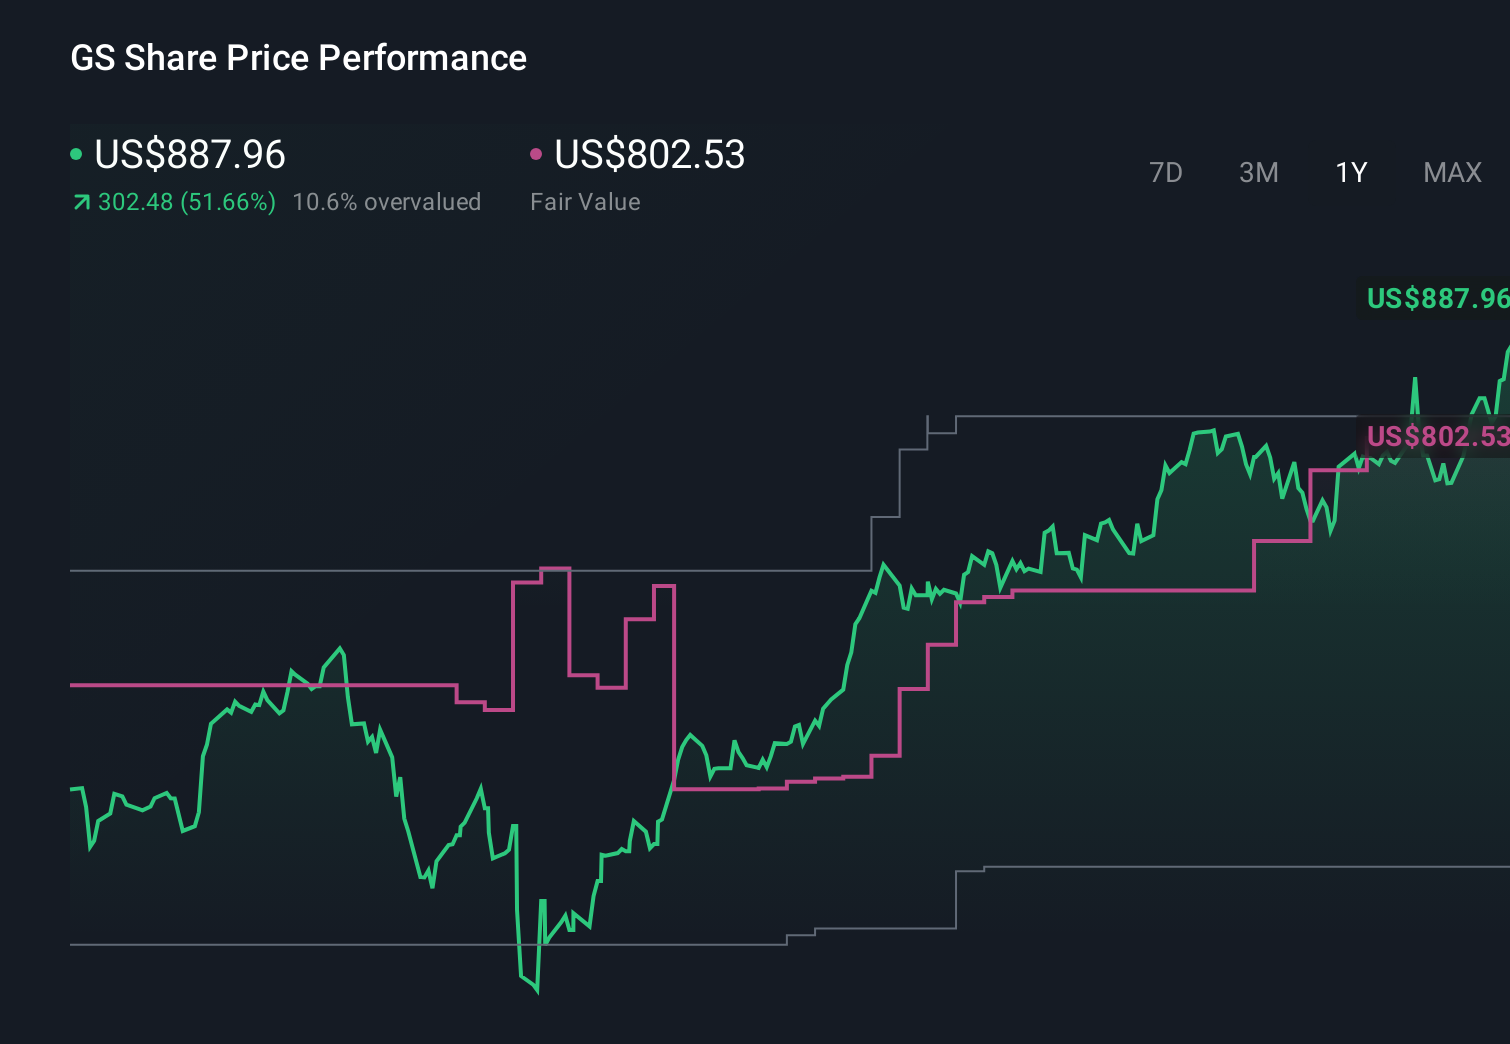
- The share price has climbed an impressive 51.7% year to date and 61.8% over the last year, even after a recent 1.9% pullback over the past week and a 12.5% gain in the last 30 days. This puts its longer term 3 year and 5 year returns at 168.6% and 283.1% respectively.
- Investors have been reacting to a mix of macro and sector specific headlines, from shifting expectations around interest rates and deal making activity on Wall Street to renewed optimism about the profitability of large investment banks. At the same time, regulatory developments and commentary about capital requirements and trading activity have added another layer of nuance to how the market is pricing Goldman Sachs Group today.
- Despite that strong backdrop, our Simply Wall St valuation checks give Goldman Sachs Group a score of 3/6, suggesting some metrics flag it as undervalued while others look more fully priced. Next we will walk through the standard valuation approaches before finishing with a more holistic way to think about what this stock is really worth.
Approach 1: Goldman Sachs Group Excess Returns Analysis
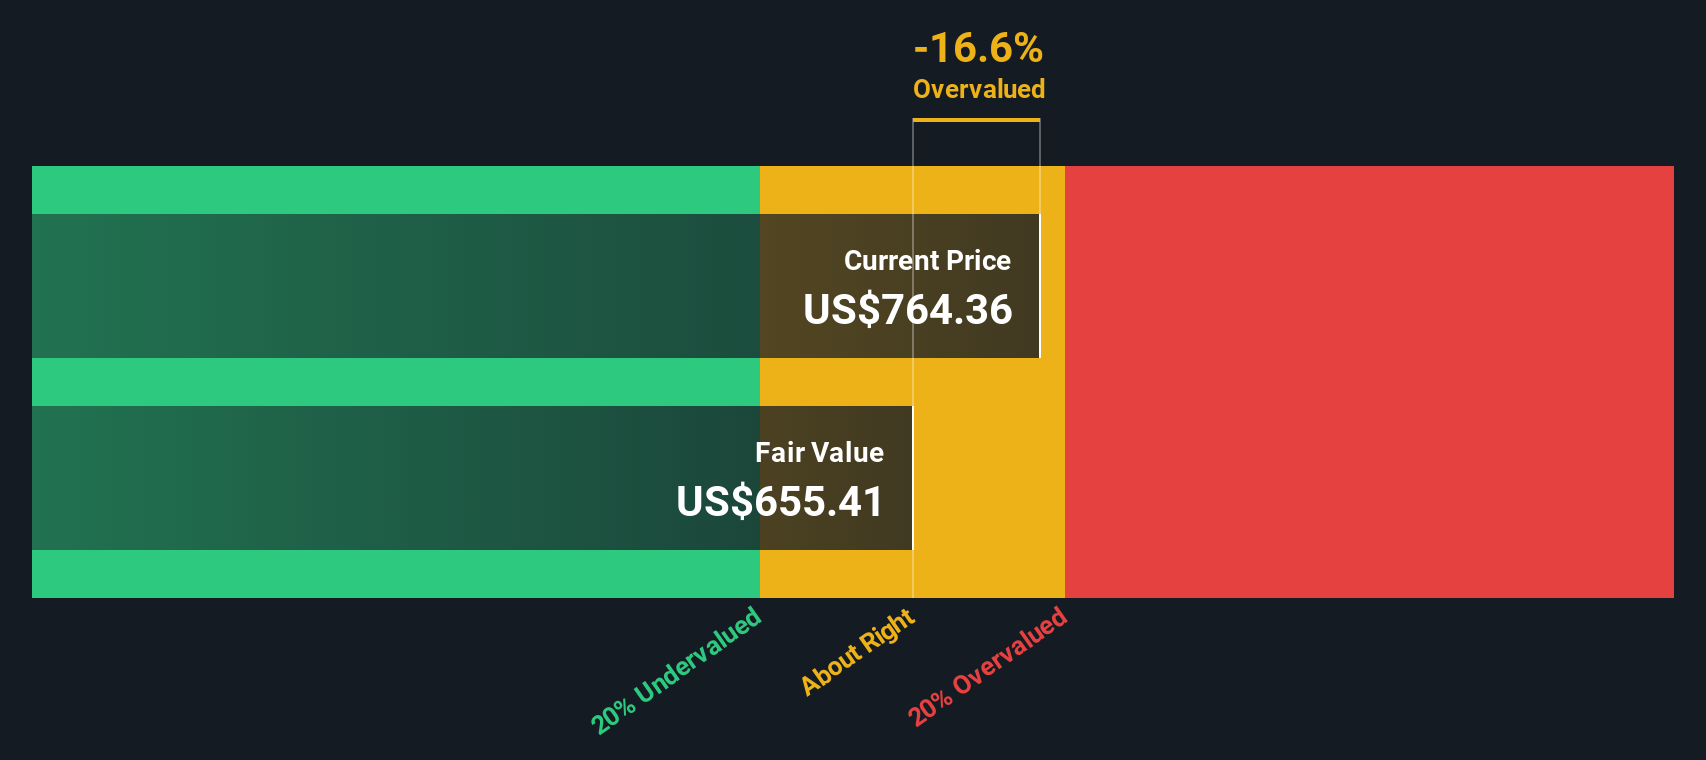
The Excess Returns model looks at how much profit Goldman Sachs Group can generate above the return that investors demand on its equity, then capitalizes those surplus profits into an intrinsic value per share.
For Goldman Sachs Group, the current Book Value is $348.02 per share and analysts expect a Stable EPS of $58.56 per share, based on weighted future Return on Equity estimates from 13 analysts. With an Average Return on Equity of 15.21%, the bank is projected to earn more on its equity base than its Cost of Equity, which is estimated at $48.13 per share.
The difference between what it earns and what investors require, the Excess Return, comes out at $10.43 per share. Using a Stable Book Value forecast of $385.04 per share, sourced from 15 analysts, these excess returns are projected forward and discounted to arrive at an intrinsic value under the Excess Returns framework.
This model implies that Goldman Sachs Group is 75.2% overvalued relative to its current share price, suggesting the market is paying a steep premium for its expected profitability.
Result: OVERVALUED
Our Excess Returns analysis suggests Goldman Sachs Group may be overvalued by 75.2%. Discover 914 undervalued stocks or create your own screener to find better value opportunities.
Approach 2: Goldman Sachs Group Price vs Earnings
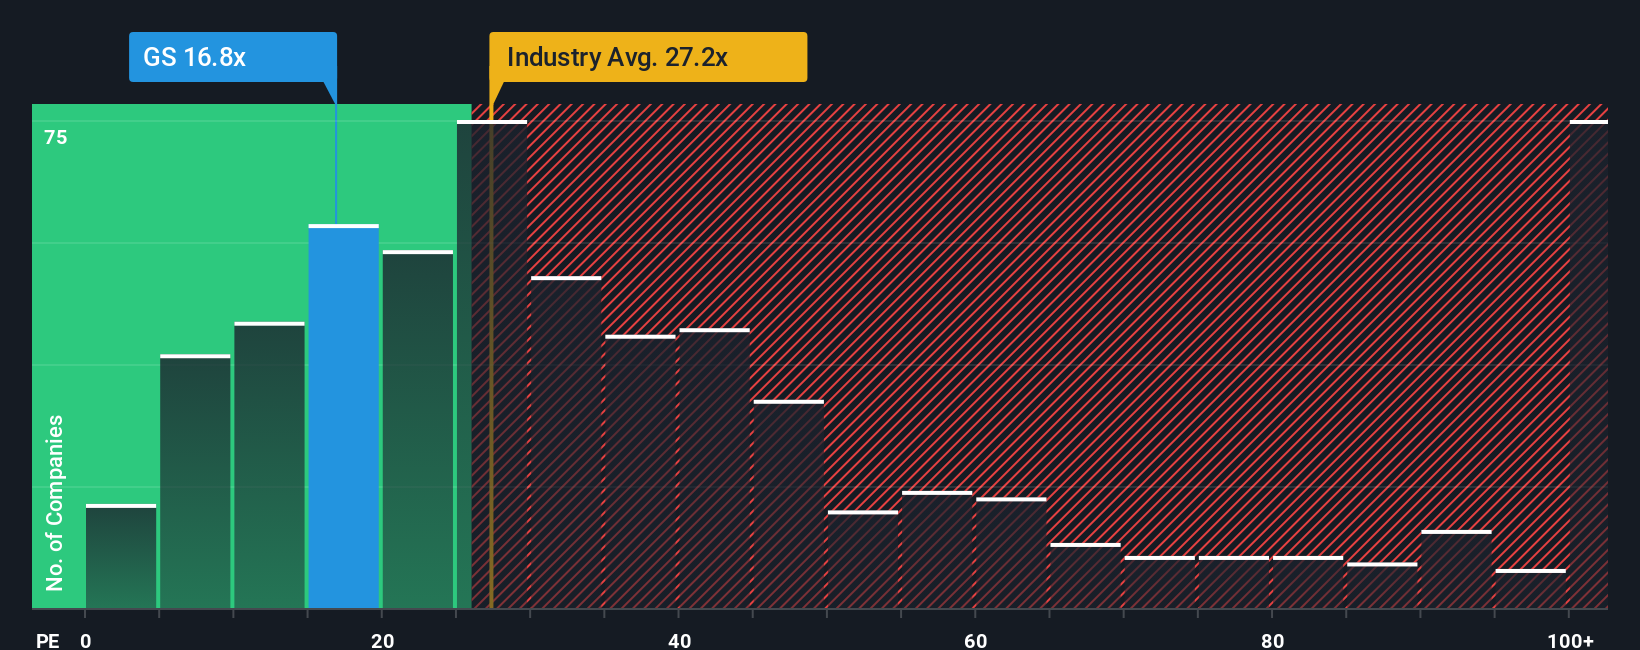
For a profitable, mature business like Goldman Sachs Group, the price to earnings, or PE, ratio is a useful way to see how much investors are paying for each dollar of current earnings. It captures both what the company is earning today and what the market expects those earnings to do in the future.
In general, higher expected growth and lower perceived risk justify a higher PE ratio, while slower growth or higher risk usually warrant a lower one. Goldman Sachs currently trades on a PE of 17.33x, which sits below both the Capital Markets industry average of 25.50x and the broader peer average of 29.44x. This suggests the market is more cautious on its earnings than on many rivals.
Simply Wall St also calculates a Fair Ratio of 19.14x, a proprietary PE multiple that reflects Goldman Sachs Group specific earnings growth outlook, industry, profit margins, market cap and risk profile. This tailored yardstick is more informative than a simple industry or peer comparison because it adjusts for the company unique fundamentals rather than assuming all Capital Markets stocks deserve the same multiple. With the actual PE modestly below this Fair Ratio, the shares screen as modestly undervalued on this metric.
Result: UNDERVALUED
PE ratios tell one story, but what if the real opportunity lies elsewhere? Discover 1462 companies where insiders are betting big on explosive growth.
Upgrade Your Decision Making: Choose your Goldman Sachs Group Narrative
Earlier we mentioned that there is an even better way to understand valuation, so let us introduce you to Narratives, a simple way to attach your story about Goldman Sachs Group to the numbers you believe in, like its future revenue, earnings, margins and fair value. A Narrative links what you think is happening in the business to a concrete financial forecast, and then to a fair value estimate you can compare directly with today price to decide whether to buy, hold or sell. On Simply Wall St, millions of investors share and refine these Narratives on the Community page, where you can see how different assumptions about deal making, asset management growth, risk and required returns translate into very different fair values. For example, some investors currently think Goldman Sachs Group is worth closer to $815 per share while others see fair value nearer $538, and the platform keeps these Narratives updated dynamically as new news, earnings and guidance come in so your decision framework evolves automatically with the latest information.
Do you think there's more to the story for Goldman Sachs Group? Head over to our Community to see what others are saying!
This article by Simply Wall St is general in nature. We provide commentary based on historical data and analyst forecasts only using an unbiased methodology and our articles are not intended to be financial advice. It does not constitute a recommendation to buy or sell any stock, and does not take account of your objectives, or your financial situation. We aim to bring you long-term focused analysis driven by fundamental data. Note that our analysis may not factor in the latest price-sensitive company announcements or qualitative material. Simply Wall St has no position in any stocks mentioned.
Have feedback on this article? Concerned about the content? Get in touch with us directly. Alternatively, email editorial-team@simplywallst.com