
 Nasdaq
 華爾街日報
華爾街日報Has Roblox Run Too Far After Its 205.8% Three Year Surge?
- Wondering if Roblox at around $85.91 is still worth chasing after its big run, or if the risk is finally catching up with the hype? In this article, we unpack what the current price really implies about future growth.
- The stock has pulled back about 9% over the last week and roughly 15.2% over the past month, even though it is still up around 46% year to date and 46.1% over the past year, and a huge 205.8% over three years.
- Recent moves have been driven by shifting sentiment around user engagement trends, platform monetization, and how investors see Roblox fitting into the broader gaming and metaverse landscape. Analysts and investors have also been reacting to ongoing product updates, partnerships, and platform safety and content initiatives. All of these factors feed into assumptions about Roblox's long term growth runway and risk profile.
- Despite all that excitement, Roblox currently scores just 1 out of 6 on our valuation checks, so on paper it does not look obviously cheap yet. Next we will walk through different valuation approaches to see what the market might be pricing in today, and then finish with a more holistic way to think about Roblox's value beyond the usual models.
Roblox scores just 1/6 on our valuation checks. See what other red flags we found in the full valuation breakdown.
Approach 1: Roblox Discounted Cash Flow (DCF) Analysis
A Discounted Cash Flow model estimates what a company is worth today by projecting its future cash flows and then discounting those back to their present value. For Roblox, the model uses a 2 stage Free Cash Flow to Equity approach based on cash flow projections in $.
Roblox generated trailing twelve month free cash flow of about $1.03 billion, and analysts see this growing strongly over the next several years. By 2029, free cash flow is projected to reach roughly $3.28 billion, with longer term estimates extrapolated by Simply Wall St out to 2035, where projected free cash flow rises to around $5.83 billion.
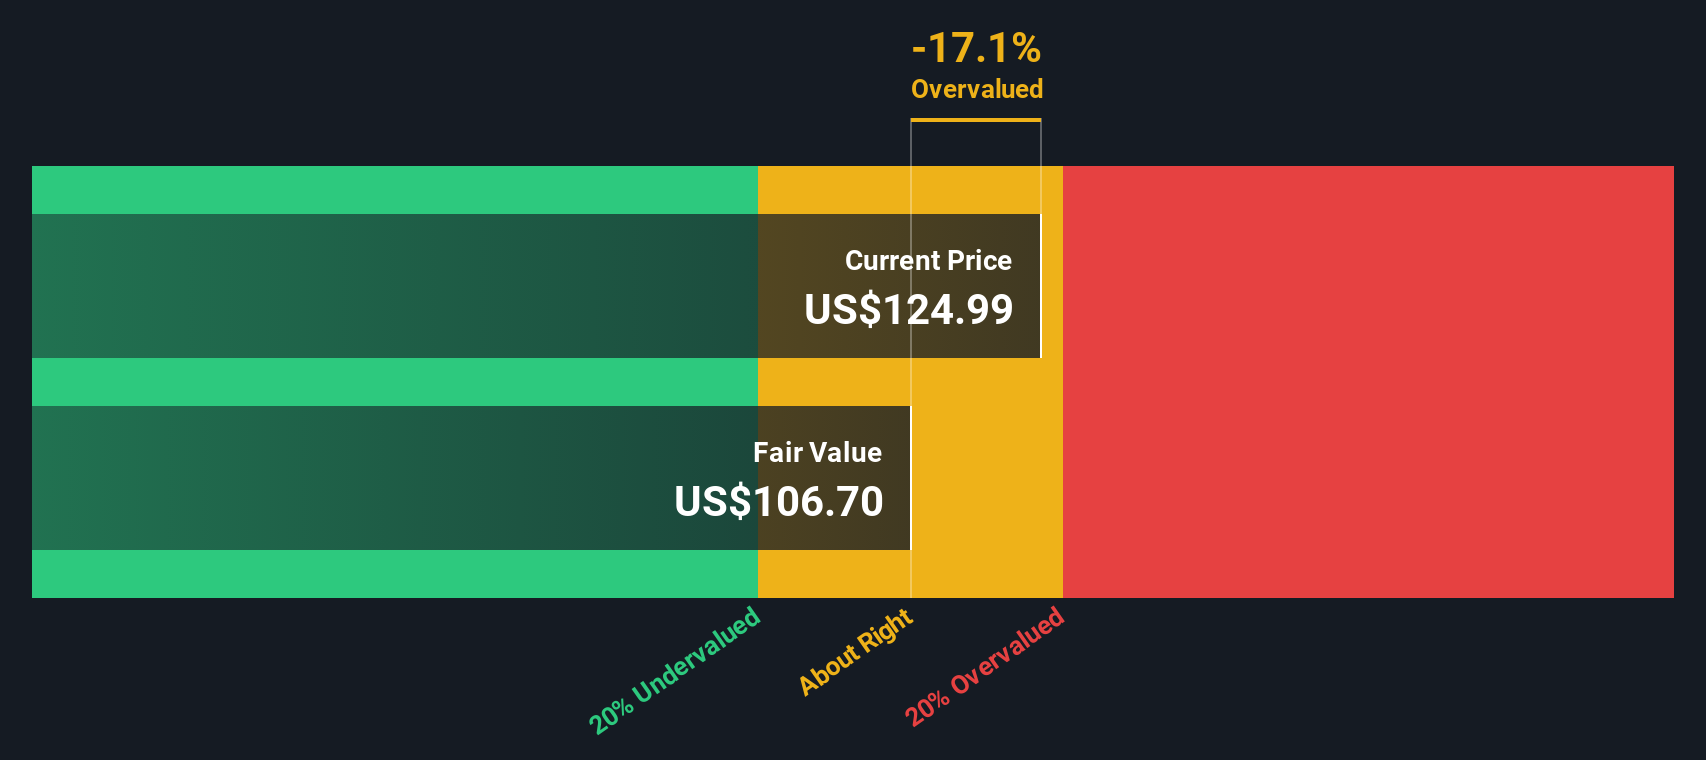
Discounting these future cash flows back to today produces an estimated intrinsic value of about $94.78 per share. Compared with the recent share price around $85.91, the DCF suggests the stock is roughly 9.4% undervalued. This is close enough that it can be treated as broadly in line with fair value rather than a significant discount.
Result: ABOUT RIGHT
Roblox is fairly valued according to our Discounted Cash Flow (DCF), but this can change at a moment's notice. Track the value in your watchlist or portfolio and be alerted on when to act.
Approach 2: Roblox Price vs Sales
For companies like Roblox that are still working toward consistent profitability, the price to sales multiple is often the cleanest way to compare valuation because revenue is more stable and less affected by near term investment spending than earnings.
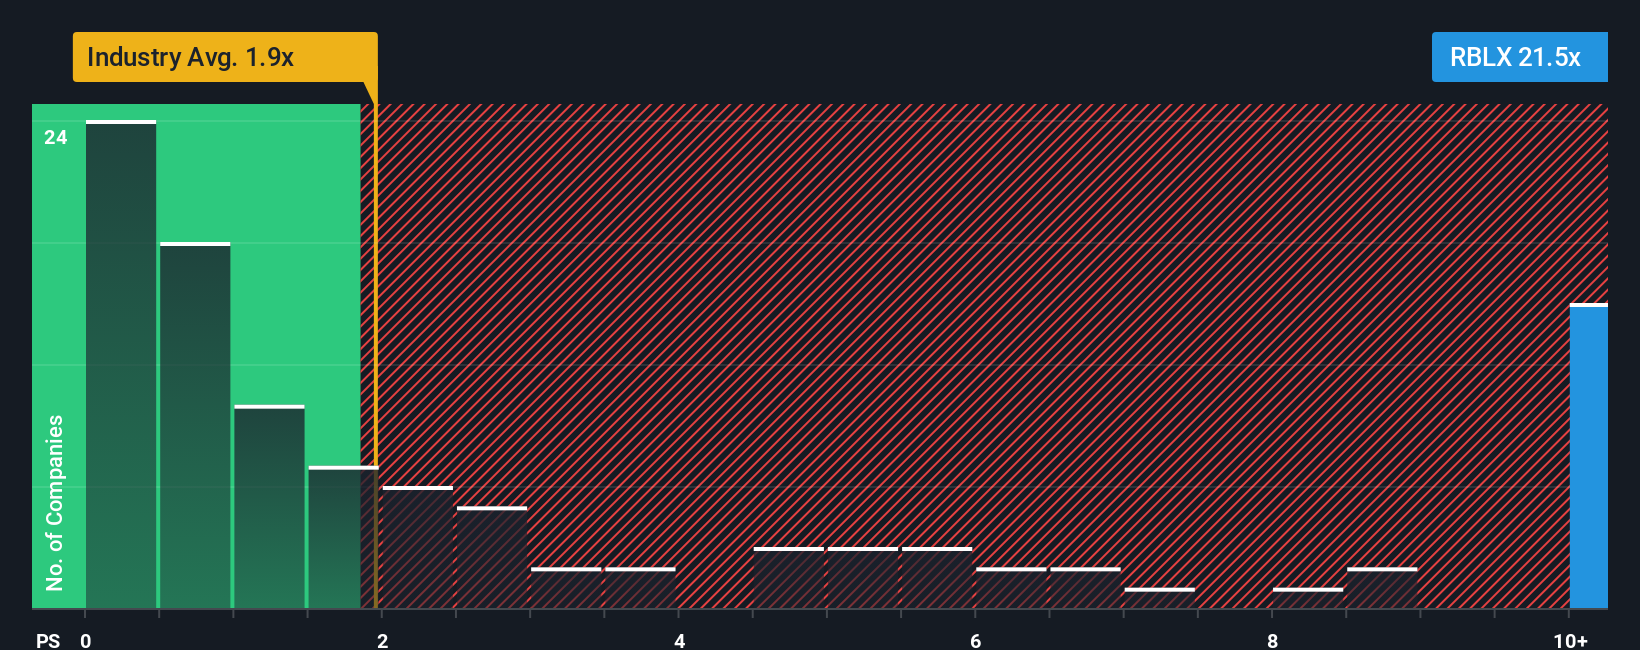
In general, higher growth and lower risk justify a higher normal multiple, while slower or more uncertain growth should trade closer to, or below, the market and industry averages. Roblox currently trades on about 13.51x sales, which is not only far above the broader Entertainment industry average of roughly 1.33x, but also well ahead of its closer peer group around 4.13x.
Simply Wall St’s Fair Ratio is a proprietary estimate of what Roblox’s price to sales multiple should be, given its growth outlook, margins, risk profile, industry and market cap. Because it adjusts for these fundamentals, it is more informative than a simple comparison with peers or the industry, which may have very different growth or risk characteristics. For Roblox, the Fair Ratio is 4.96x, substantially below the current 13.51x, which suggests the stock is pricing in a lot of optimism relative to its fundamentals.
Result: OVERVALUED
PS ratios tell one story, but what if the real opportunity lies elsewhere? Discover 1462 companies where insiders are betting big on explosive growth.
Upgrade Your Decision Making: Choose your Roblox Narrative
Earlier we mentioned that there is an even better way to understand valuation, so let us introduce you to Narratives, a simple way to attach your story about a company to the numbers behind its assumed fair value and estimates for future revenue, earnings and margins. This lets you clearly see how the story links to a financial forecast and then to a fair value. On Simply Wall St, Narratives live inside the Community page and are used by millions of investors as an easy, accessible tool for turning a high level thesis into concrete forecasts you can compare with the current share price to decide whether to buy, hold, or sell. They update dynamically as new information like earnings or major news comes in, so your view stays current rather than static. For Roblox, for example, one investor might build a very optimistic Narrative that leans into rapid international expansion, growing high margin advertising and rewarded video, and a long growth runway that supports a fair value around $175. A more cautious investor might focus on rising costs, competitive pressure, safety concerns and execution risk that cap their fair value closer to $62.
Do you think there's more to the story for Roblox? Head over to our Community to see what others are saying!

This article by Simply Wall St is general in nature. We provide commentary based on historical data and analyst forecasts only using an unbiased methodology and our articles are not intended to be financial advice. It does not constitute a recommendation to buy or sell any stock, and does not take account of your objectives, or your financial situation. We aim to bring you long-term focused analysis driven by fundamental data. Note that our analysis may not factor in the latest price-sensitive company announcements or qualitative material. Simply Wall St has no position in any stocks mentioned.
Have feedback on this article? Concerned about the content? Get in touch with us directly. Alternatively, email editorial-team@simplywallst.com