
 Nasdaq
 華爾街日報
華爾街日報Is Ferrari Still Worth Its Premium After The Recent 13.7% Share Price Slide?
- If you are wondering whether Ferrari's premium share price still makes sense or if there is a hidden opportunity here, you are in the right place as we unpack what the market is really paying for this brand.
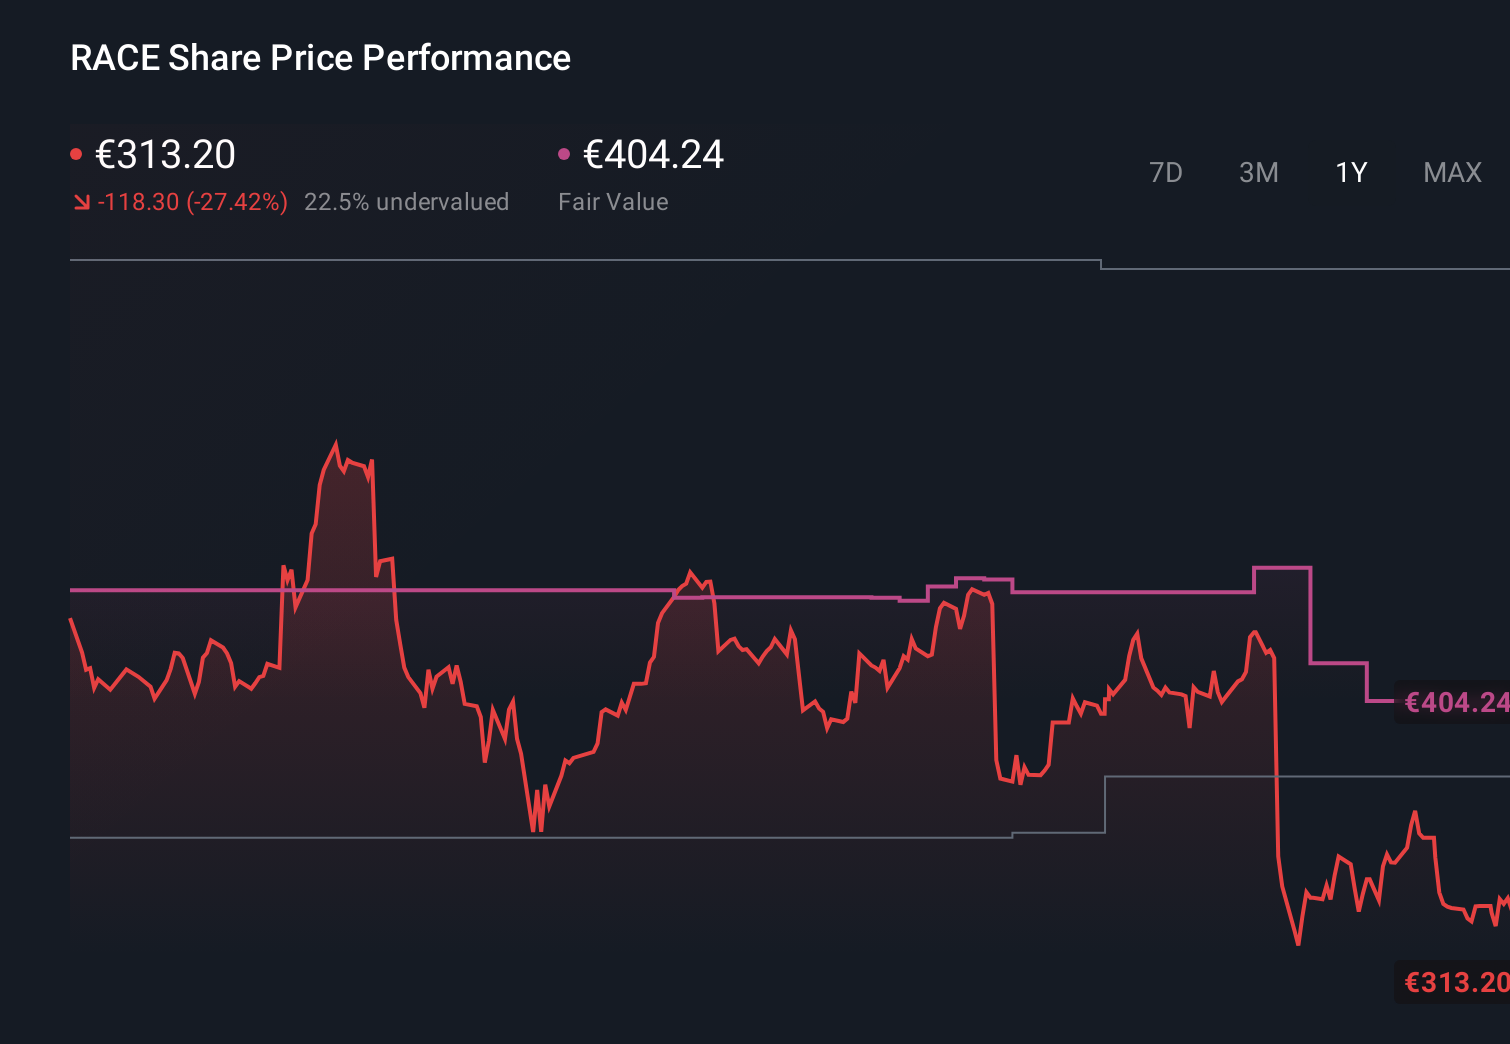
- After an exceptional multi year run, with the stock up 76.7% over 3 years and 68.2% over 5 years, recent returns have cooled, with the share price down 1.3% over 7 days, 11.2% over 30 days and 11.0% year to date, contributing to a 13.7% drop over the last year.
- That pullback comes as investors reassess luxury auto names in light of shifting demand for high end vehicles and evolving expectations around electrification and regulation. At the same time, Ferrari continues to lean on its scarcity driven pricing power, brand partnerships and motorsport halo to support the view that it is more luxury house than carmaker.
- Right now Ferrari scores just 1 out of 6 on our undervaluation checks. This suggests the stock does not screen as obviously cheap on traditional metrics. The real story will emerge as we walk through the main valuation methods and, later on, a more holistic way to judge what this business is truly worth.
Ferrari scores just 1/6 on our valuation checks. See what other red flags we found in the full valuation breakdown.
Approach 1: Ferrari Discounted Cash Flow (DCF) Analysis
A Discounted Cash Flow model estimates what a business is worth today by projecting its future cash flows and then discounting those back to the present. For Ferrari, this 2 stage Free Cash Flow to Equity model starts from last twelve month free cash flow of about €1.28 billion and extends analyst forecasts into longer term projections.
Analysts expect free cash flow to rise steadily, with projections climbing from around €1.43 billion in 2026 to roughly €2.66 billion by 2035. After the explicit forecast period, Simply Wall St extrapolates growth at moderating rates to reflect a more mature phase for the business rather than perpetual high growth.
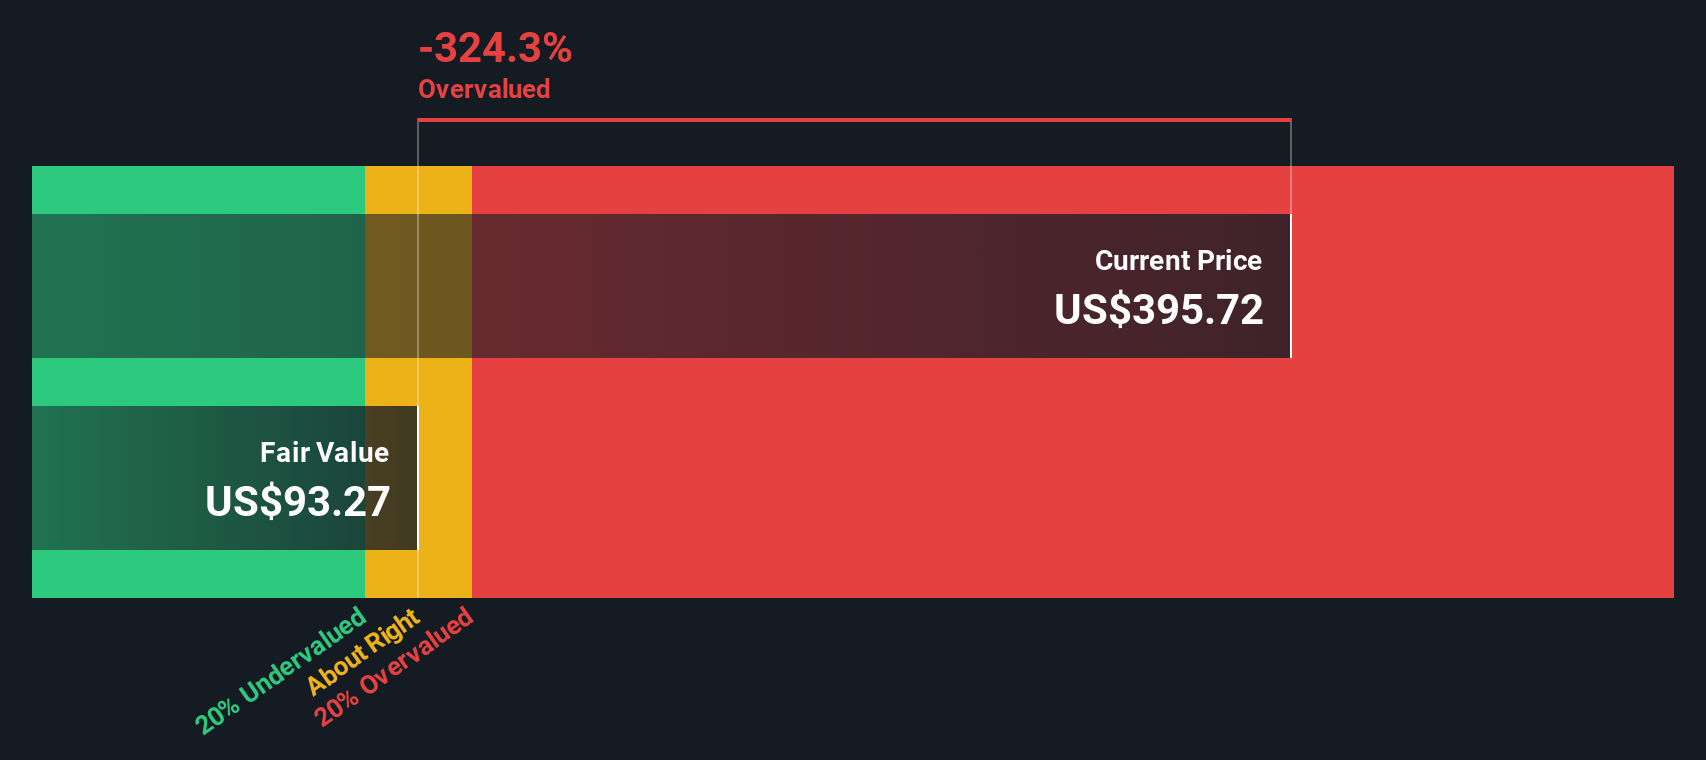
Bringing all those future cash flows back to today in the model gives an estimated intrinsic value of about $106.55 per share. Compared with the current share price, this implies Ferrari is roughly 247.7% overvalued on a pure cash flow basis. This suggests the market is paying a substantial premium to the cash that the company is expected to generate.
Result: OVERVALUED
Our Discounted Cash Flow (DCF) analysis suggests Ferrari may be overvalued by 247.7%. Discover 912 undervalued stocks or create your own screener to find better value opportunities.
Approach 2: Ferrari Price vs Earnings
For a consistently profitable company like Ferrari, the price to earnings ratio is a useful way to gauge how much investors are willing to pay for each dollar of current profit. In broad terms, faster growth and lower perceived risk usually justify a higher PE, while slower growth or higher uncertainty call for a lower, more conservative multiple.
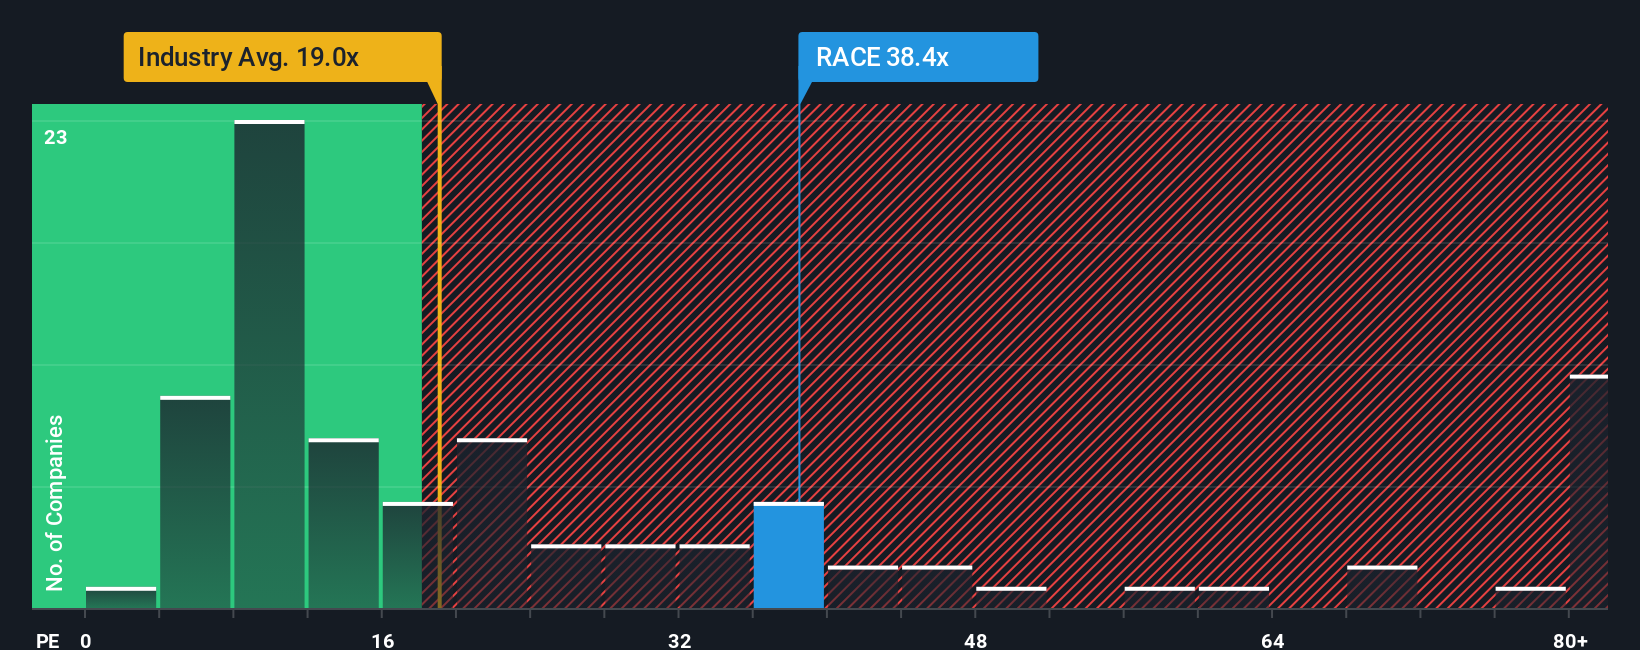
Ferrari currently trades on a PE of about 34.8x, which is notably richer than the Auto industry average of around 18.4x and also above the peer average of roughly 18.1x. To move beyond simple comparisons, Simply Wall St calculates a Fair Ratio: an estimate of what a reasonable PE should be for Ferrari given its earnings growth profile, profitability, industry, market cap and risk characteristics. For Ferrari, that Fair Ratio is 17.0x.
Because the Fair Ratio explicitly adjusts for Ferrari specific growth and risk factors, it gives a more tailored view than broad peer or industry averages. On this basis, the current 34.8x multiple sits well above the 17.0x Fair Ratio, which indicates that the stock price reflects a very optimistic outlook.
Result: OVERVALUED
PE ratios tell one story, but what if the real opportunity lies elsewhere? Discover 1462 companies where insiders are betting big on explosive growth.
Upgrade Your Decision Making: Choose your Ferrari Narrative
Earlier we mentioned that there is an even better way to understand valuation, so let us introduce you to Narratives. Narratives are simple stories that link your view of Ferrari’s business, like how quickly revenue grows, how margins evolve and what multiple it deserves, to a structured forecast, a personal fair value and a clear buy or sell view. You can explore these on Simply Wall St’s Community page, where millions of investors share dynamic Narratives that automatically update when new earnings or news arrives. This makes it easy to compare your own fair value to the current share price and to see how, for example, one bullish Ferrari Narrative might lean into premium positioning, electrification upside and a 63.6x future PE to justify a target near the most optimistic analyst level around $597. A more cautious Narrative could focus on execution risks, brand dilution and macro uncertainty to arrive closer to the lower end of Street expectations near $397, giving you a practical range to anchor your decisions.
Do you think there's more to the story for Ferrari? Head over to our Community to see what others are saying!
This article by Simply Wall St is general in nature. We provide commentary based on historical data and analyst forecasts only using an unbiased methodology and our articles are not intended to be financial advice. It does not constitute a recommendation to buy or sell any stock, and does not take account of your objectives, or your financial situation. We aim to bring you long-term focused analysis driven by fundamental data. Note that our analysis may not factor in the latest price-sensitive company announcements or qualitative material. Simply Wall St has no position in any stocks mentioned.
Have feedback on this article? Concerned about the content? Get in touch with us directly. Alternatively, email editorial-team@simplywallst.com