
 Nasdaq
 華爾街日報
華爾街日報Sumitomo Electric Industries, Ltd.'s (TSE:5802) institutional investors lost 8.9% last week but have benefitted from longer-term gains
Key Insights
- Significantly high institutional ownership implies Sumitomo Electric Industries' stock price is sensitive to their trading actions
- The top 25 shareholders own 45% of the company
- Analyst forecasts along with ownership data serve to give a strong idea about prospects for a business
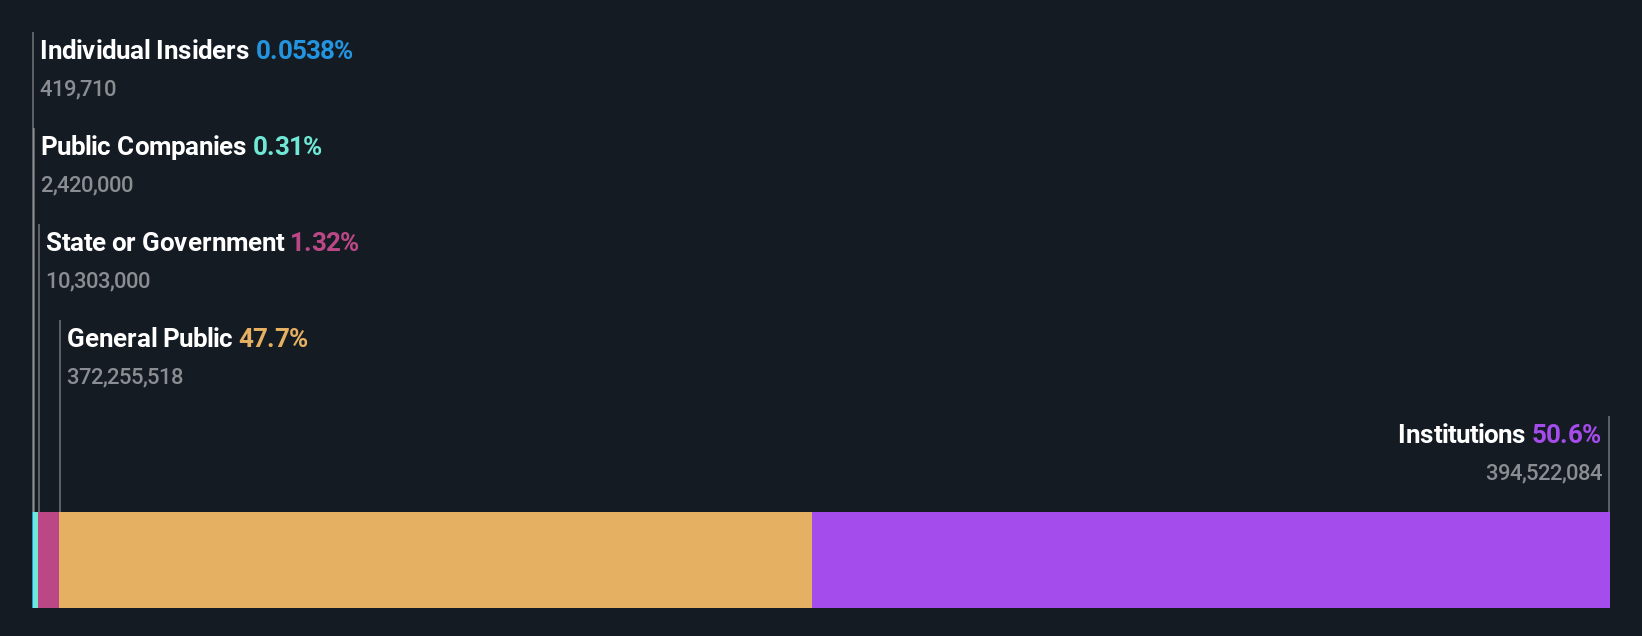
To get a sense of who is truly in control of Sumitomo Electric Industries, Ltd. (TSE:5802), it is important to understand the ownership structure of the business. The group holding the most number of shares in the company, around 51% to be precise, is institutions. Put another way, the group faces the maximum upside potential (or downside risk).
Institutional investors was the group most impacted after the company's market cap fell to JP¥4.9t last week. Still, the 129% one-year gains may have helped mitigate their overall losses. We would assume however, that they would be on the lookout for weakness in the future.
Let's take a closer look to see what the different types of shareholders can tell us about Sumitomo Electric Industries.
See our latest analysis for Sumitomo Electric Industries
What Does The Institutional Ownership Tell Us About Sumitomo Electric Industries?
Many institutions measure their performance against an index that approximates the local market. So they usually pay more attention to companies that are included in major indices.
We can see that Sumitomo Electric Industries does have institutional investors; and they hold a good portion of the company's stock. This can indicate that the company has a certain degree of credibility in the investment community. However, it is best to be wary of relying on the supposed validation that comes with institutional investors. They too, get it wrong sometimes. If multiple institutions change their view on a stock at the same time, you could see the share price drop fast. It's therefore worth looking at Sumitomo Electric Industries' earnings history below. Of course, the future is what really matters.

Investors should note that institutions actually own more than half the company, so they can collectively wield significant power. Sumitomo Electric Industries is not owned by hedge funds. Looking at our data, we can see that the largest shareholder is Nomura Asset Management Co., Ltd. with 6.1% of shares outstanding. In comparison, the second and third largest shareholders hold about 5.4% and 4.1% of the stock.
Our studies suggest that the top 25 shareholders collectively control less than half of the company's shares, meaning that the company's shares are widely disseminated and there is no dominant shareholder.
While studying institutional ownership for a company can add value to your research, it is also a good practice to research analyst recommendations to get a deeper understand of a stock's expected performance. There are plenty of analysts covering the stock, so it might be worth seeing what they are forecasting, too.
Insider Ownership Of Sumitomo Electric Industries
The definition of company insiders can be subjective and does vary between jurisdictions. Our data reflects individual insiders, capturing board members at the very least. The company management answer to the board and the latter should represent the interests of shareholders. Notably, sometimes top-level managers are on the board themselves.
I generally consider insider ownership to be a good thing. However, on some occasions it makes it more difficult for other shareholders to hold the board accountable for decisions.
Our information suggests that Sumitomo Electric Industries, Ltd. insiders own under 1% of the company. As it is a large company, we'd only expect insiders to own a small percentage of it. But it's worth noting that they own JP¥2.7b worth of shares. In this sort of situation, it can be more interesting to see if those insiders have been buying or selling.
General Public Ownership
The general public, who are usually individual investors, hold a 48% stake in Sumitomo Electric Industries. While this group can't necessarily call the shots, it can certainly have a real influence on how the company is run.
Next Steps:
It's always worth thinking about the different groups who own shares in a company. But to understand Sumitomo Electric Industries better, we need to consider many other factors. Like risks, for instance. Every company has them, and we've spotted 2 warning signs for Sumitomo Electric Industries (of which 1 is a bit concerning!) you should know about.
If you would prefer discover what analysts are predicting in terms of future growth, do not miss this free report on analyst forecasts.
NB: Figures in this article are calculated using data from the last twelve months, which refer to the 12-month period ending on the last date of the month the financial statement is dated. This may not be consistent with full year annual report figures.
Have feedback on this article? Concerned about the content? Get in touch with us directly. Alternatively, email editorial-team (at) simplywallst.com.
This article by Simply Wall St is general in nature. We provide commentary based on historical data and analyst forecasts only using an unbiased methodology and our articles are not intended to be financial advice. It does not constitute a recommendation to buy or sell any stock, and does not take account of your objectives, or your financial situation. We aim to bring you long-term focused analysis driven by fundamental data. Note that our analysis may not factor in the latest price-sensitive company announcements or qualitative material. Simply Wall St has no position in any stocks mentioned.