
 Nasdaq
 華爾街日報
華爾街日報Is PepsiCo Fairly Priced After Cash Flow Upside and 4% Weekly Share Price Gain?
- Wondering if PepsiCo at $150.37 is a solid long term buy or quietly overpriced? You are not alone. This is exactly the kind of stock where valuation really matters.
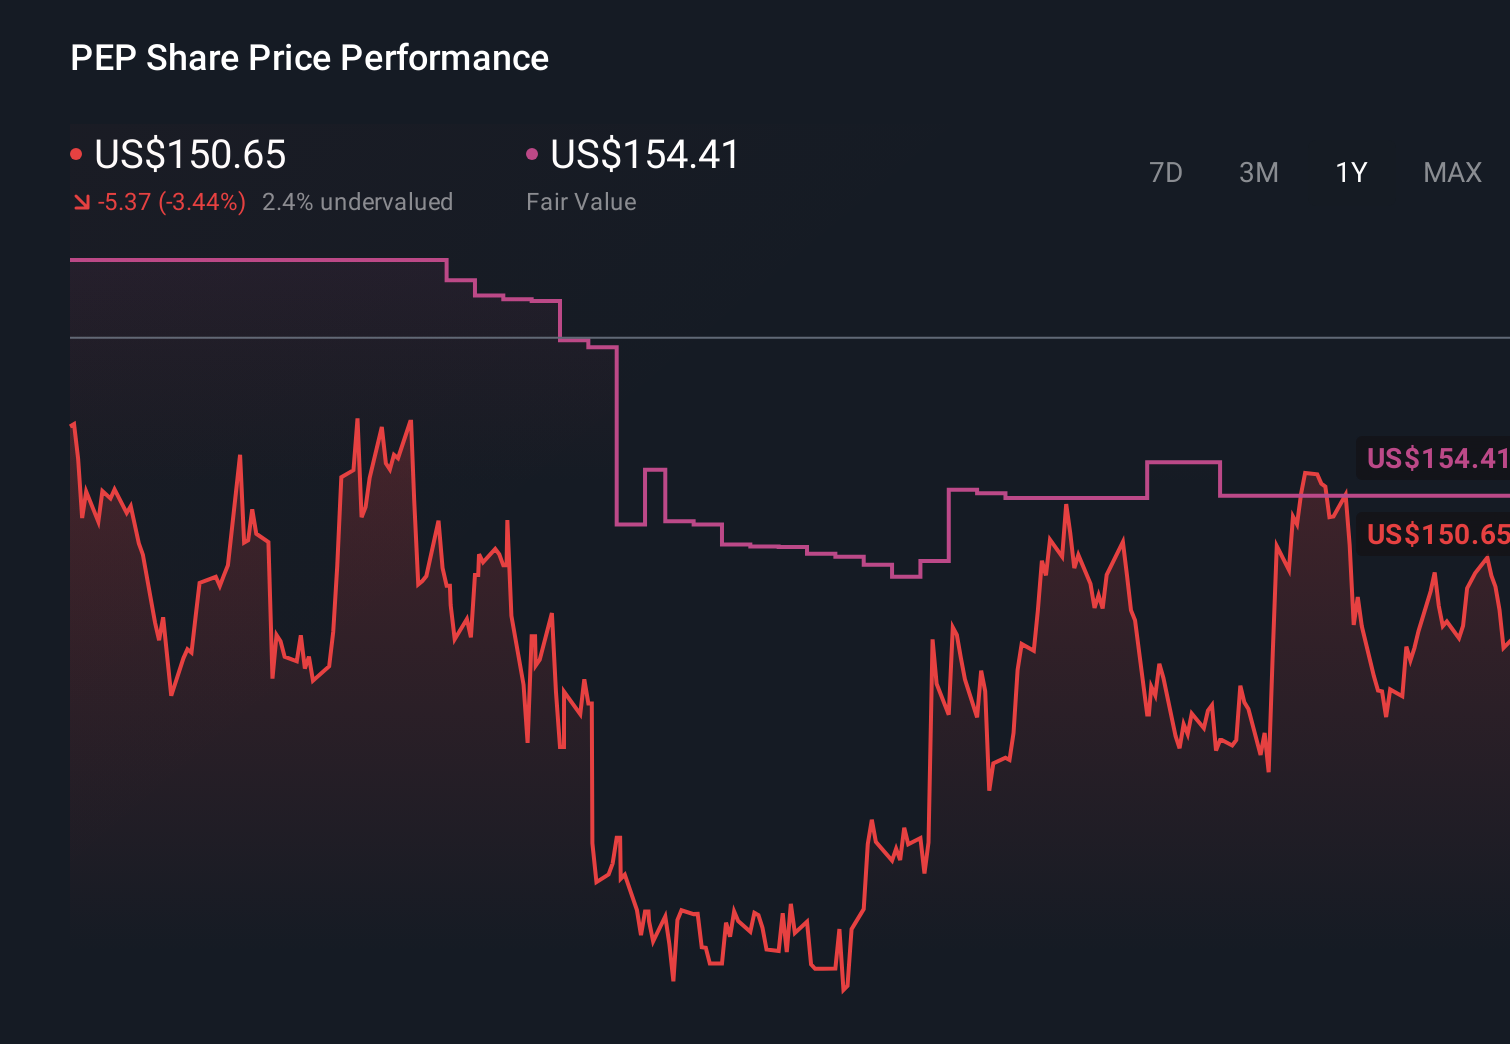
- Over the last week the share price has climbed 4.0%, adding to a 3.1% gain over 30 days. Zooming out shows a flat 0.2% return over 1 year and 21.8% over 5 years, after a bumpy 3 year stretch at -8.4%.
- Recently, investors have been reacting to PepsiCo's ongoing push into higher margin snacks, its portfolio reshaping in international markets, and continued investment in healthier product lines. All of these can influence long term growth expectations and risk perceptions. Strategic moves like these often shift how the market values a mature staple name, especially when defensive characteristics are back in favor.
- Right now PepsiCo scores a 2/6 valuation check score, which suggests some pockets of value but also areas where the stock looks fully priced. Next we will break down what different valuation methods say about PEP and then finish with a more holistic way to judge whether the current price really makes sense.
PepsiCo scores just 2/6 on our valuation checks. See what other red flags we found in the full valuation breakdown.
Approach 1: PepsiCo Discounted Cash Flow (DCF) Analysis
A Discounted Cash Flow model estimates what a business is worth by projecting its future cash flows and discounting them back to today in $ terms. For PepsiCo, the 2 stage Free Cash Flow to Equity model starts with last twelve month free cash flow of about $6.4 billion and builds up from there.
Analysts expect free cash flow to continue rising, with projections moving into the low teens of billions of $ over the next few years and reaching around $13.7 billion by 2029. Beyond the explicit analyst period, Simply Wall St extrapolates the trend at moderating growth rates to reflect a mature, but still expanding, consumer staples business.
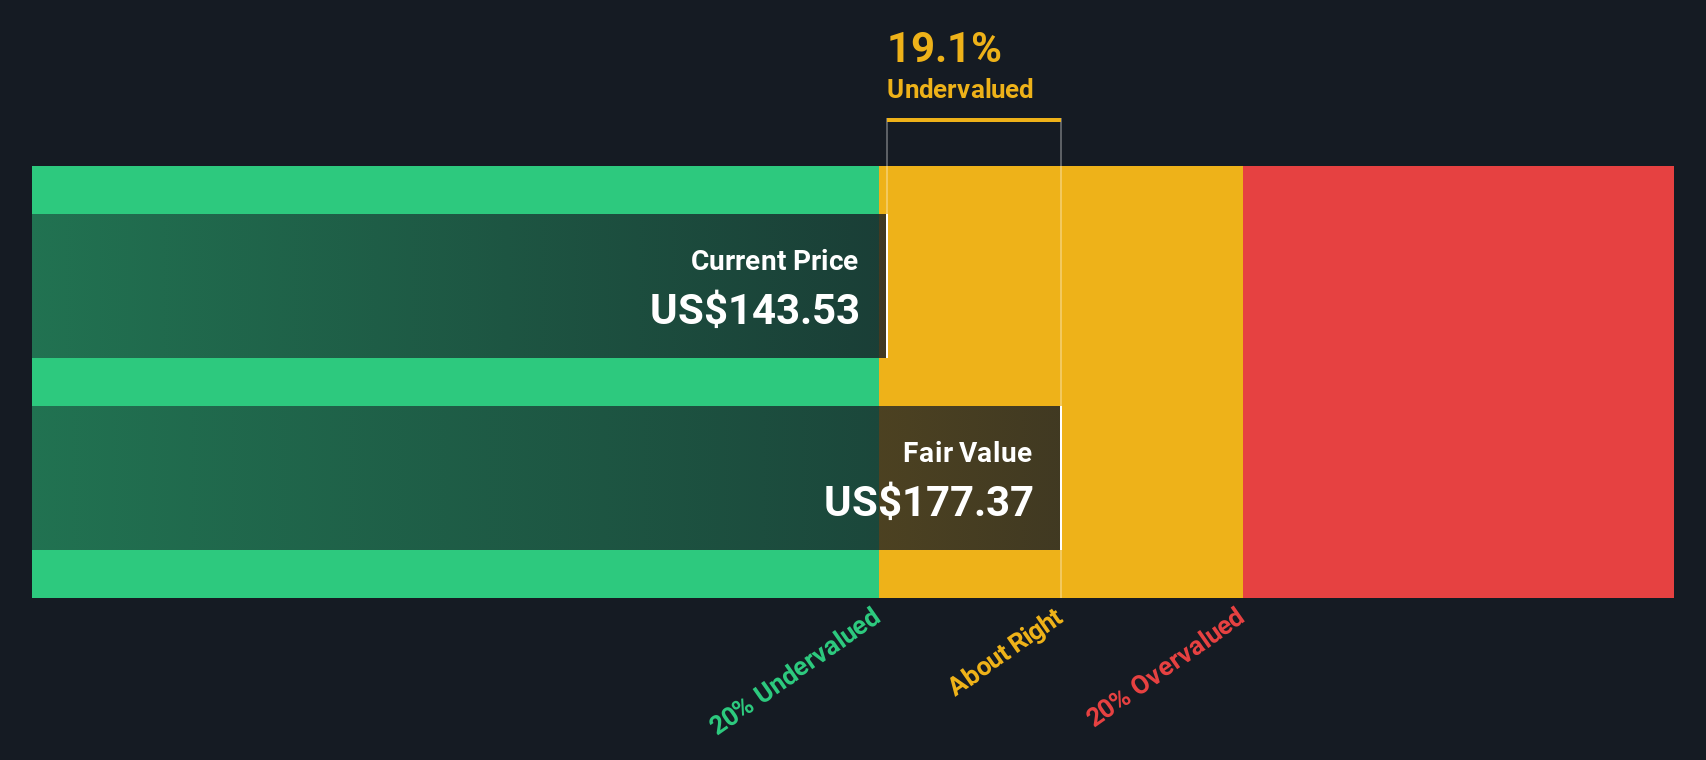
When all of these projected cash flows are discounted back to today, the model arrives at an estimated intrinsic value of roughly $246.93 per share, compared with the current price of about $150.37. That implies PepsiCo is trading at roughly a 39.1% discount to its DCF value. This suggests investors may be underestimating the durability and growth of its cash generation.
Result: UNDERVALUED
Our Discounted Cash Flow (DCF) analysis suggests PepsiCo is undervalued by 39.1%. Track this in your watchlist or portfolio, or discover 909 more undervalued stocks based on cash flows.
Approach 2: PepsiCo Price vs Earnings
For profitable, established companies like PepsiCo, the Price to Earnings, or PE, ratio is a practical way to judge valuation because it directly links what investors pay for each share to the profits the business is currently generating.
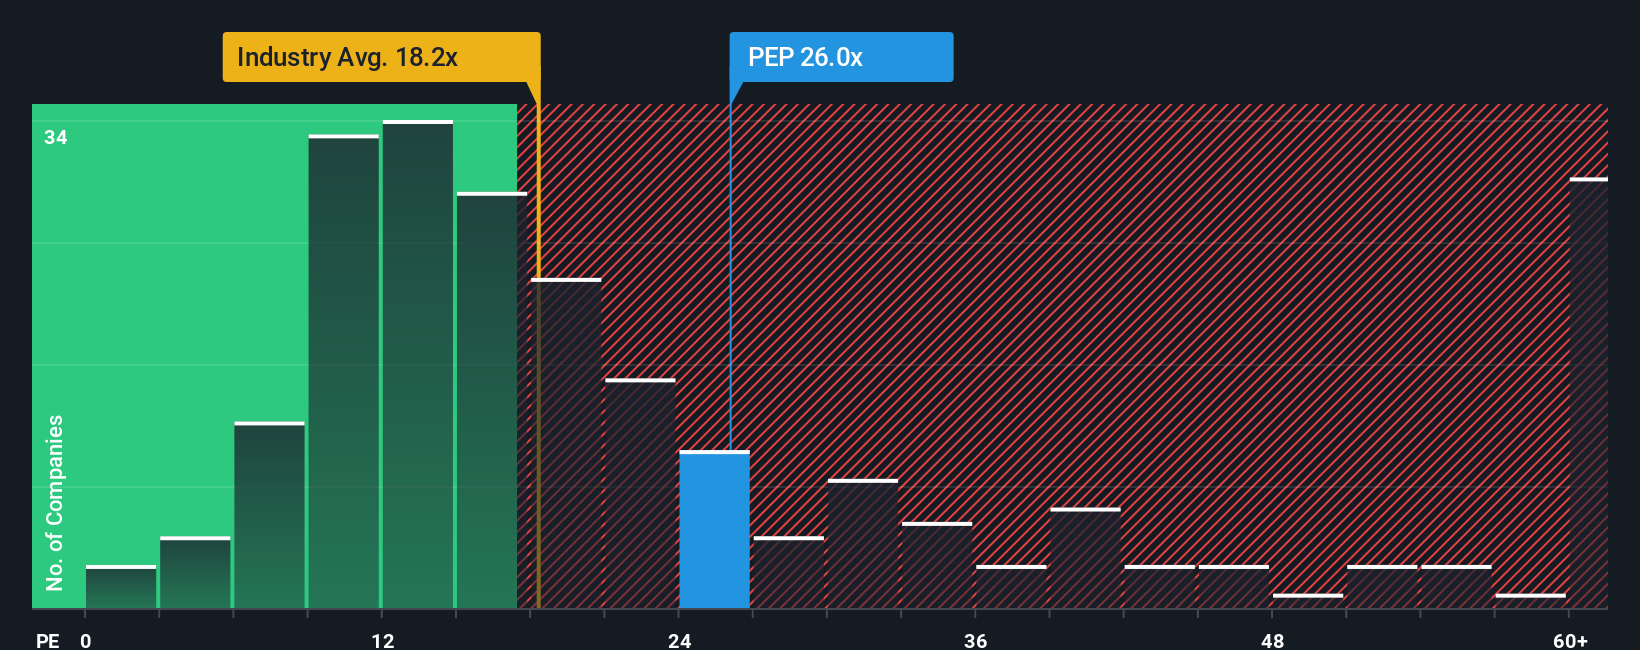
In general, faster growth and lower perceived risk justify a higher, or more generous, PE multiple, while slower or volatile earnings, and higher uncertainty, tend to push a fair PE lower. Against that backdrop, PepsiCo currently trades on a PE of about 28.8x, which is a premium to both the wider Beverage industry average of roughly 17.4x and its direct peer group average of about 26.3x.
Simply Wall St goes a step further with its proprietary Fair Ratio, which estimates what PE you would reasonably expect for PepsiCo given its earnings growth outlook, industry, profit margins, market value and specific risk profile. This tends to be more insightful than simple peer or industry comparisons because it adjusts for company level quality and risk factors. For PepsiCo, the Fair Ratio comes out at around 27.0x, slightly below the current 28.8x, suggesting the shares are trading a bit ahead of what those fundamentals alone would justify.
Result: OVERVALUED
PE ratios tell one story, but what if the real opportunity lies elsewhere? Discover 1463 companies where insiders are betting big on explosive growth.
Upgrade Your Decision Making: Choose your PepsiCo Narrative
Earlier we mentioned that there is an even better way to understand valuation, so let us introduce you to Narratives. These are simple stories you create about PepsiCo that tie your view of its business, like international expansion, healthier products and margin improvement, to a concrete financial forecast and a fair value estimate. You can then compare that fair value to today’s price to decide whether to buy, hold or sell.
On Simply Wall St’s Community page, millions of investors use Narratives as an easy, accessible tool to set their own assumptions for future revenue, earnings and margins, see the implied fair value, and then watch that Narrative update dynamically as new news, earnings or guidance arrive, so their decisions stay in sync with reality rather than static models.
For PepsiCo, one investor might build a bullish Narrative that leans toward the higher analyst target near $175, assuming faster growth in emerging markets and premium pricing. A more cautious investor might anchor closer to the $115 bear case, assuming slower adoption of healthier products and persistent cost pressure. Both can immediately see how their story translates into numbers and whether today’s price near the middle of that range offers enough upside for their chosen level of risk.
Do you think there's more to the story for PepsiCo? Head over to our Community to see what others are saying!
This article by Simply Wall St is general in nature. We provide commentary based on historical data and analyst forecasts only using an unbiased methodology and our articles are not intended to be financial advice. It does not constitute a recommendation to buy or sell any stock, and does not take account of your objectives, or your financial situation. We aim to bring you long-term focused analysis driven by fundamental data. Note that our analysis may not factor in the latest price-sensitive company announcements or qualitative material. Simply Wall St has no position in any stocks mentioned.
Have feedback on this article? Concerned about the content? Get in touch with us directly. Alternatively, email editorial-team@simplywallst.com