
 Nasdaq
 華爾街日報
華爾街日報Is Cooper Companies Fairly Priced After Recent Share Price Rebound?
- Wondering if Cooper Companies is quietly turning into a value opportunity after a rough patch? This article will walk you through what the numbers are really saying about the stock.
- After sliding earlier this year, the share price has bounced about 3.2% in the last week and 12.4% over the last month, even though it is still down 10.6% year to date and 14.2% over the past year.
- That rebound has come as investors refocus on Cooper's positioning in specialty contact lenses and women's health, where long term structural demand remains a key part of the story. At the same time, shifting sentiment around medical device names and interest rate expectations has helped lift the whole group, giving context to Cooper's recent move.
- Right now Cooper Companies scores just 1 out of 6 on our valuation checks. Next we will dig into what the main valuation methods say about that score and hint at a more insightful way to judge fair value that we will come back to at the end of the article.
Cooper Companies scores just 1/6 on our valuation checks. See what other red flags we found in the full valuation breakdown.
Approach 1: Cooper Companies Discounted Cash Flow (DCF) Analysis
A Discounted Cash Flow, or DCF, model estimates what a business is worth by projecting the cash it can generate in the future and then discounting those dollars back into today’s terms.
For Cooper Companies, the latest twelve month Free Cash Flow sits at about $380.5 Million. Analysts provide detailed forecasts for the next few years, and from there Simply Wall St extends the trend, with projected Free Cash Flow rising to roughly $966 Million by 2030 as growth gradually moderates over time.
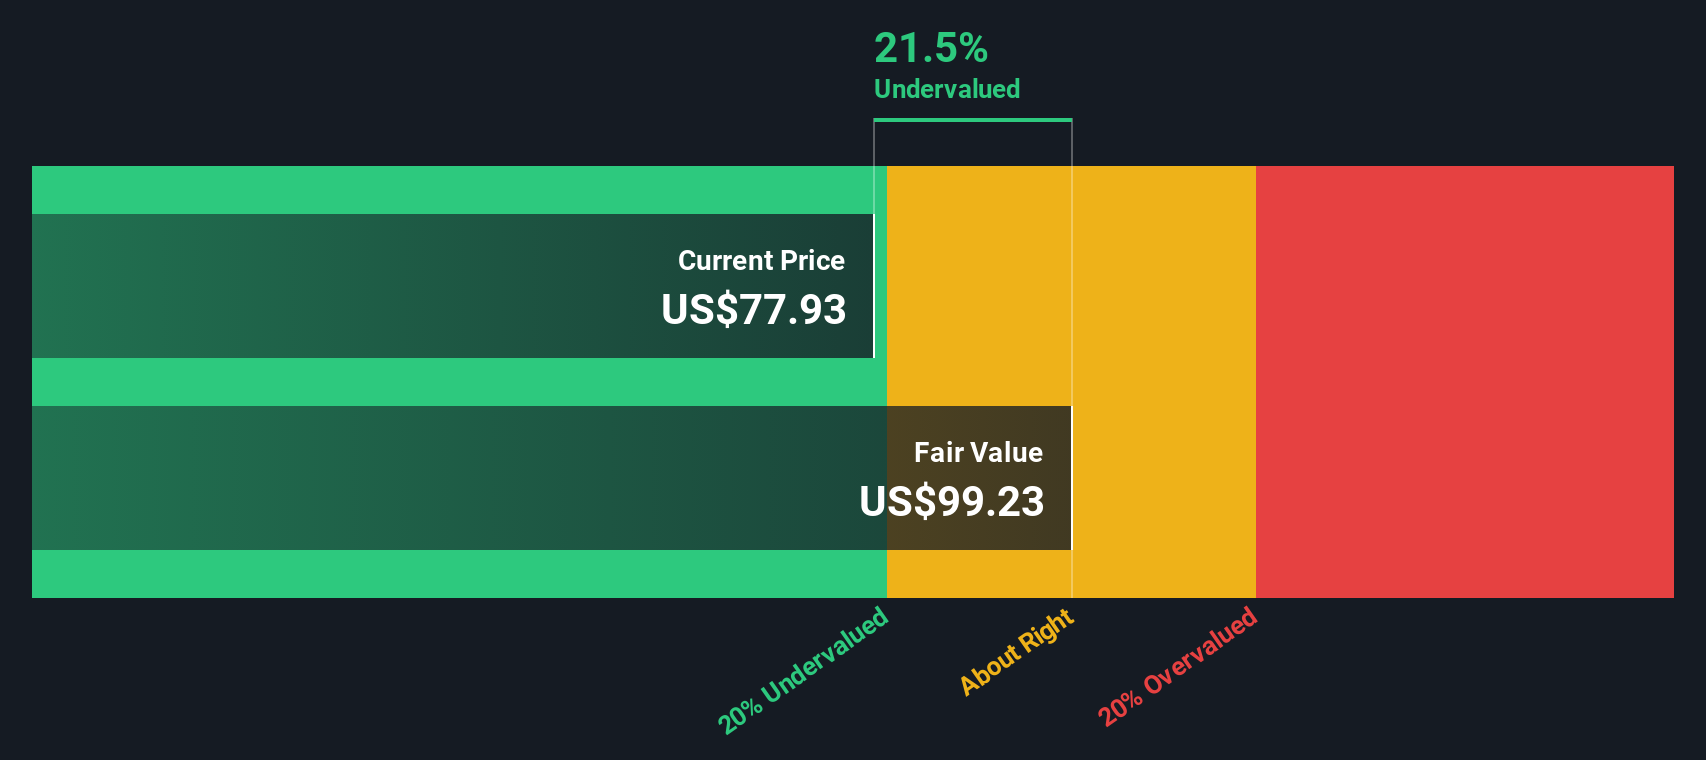
Those annual cash flows, all in dollars, are then discounted using a required rate of return to reflect risk and the time value of money. Adding them up gives an estimated intrinsic value of about $88.00 per share under this 2 Stage Free Cash Flow to Equity model. Compared with the current market price, this implies Cooper Companies is trading at roughly a 7.9% discount. This is close enough to suggest the shares are broadly in line with fair value rather than a screaming bargain.
Result: ABOUT RIGHT
Cooper Companies is fairly valued according to our Discounted Cash Flow (DCF), but this can change at a moment's notice. Track the value in your watchlist or portfolio and be alerted on when to act.
Approach 2: Cooper Companies Price vs Earnings
For profitable companies like Cooper Companies, the price to earnings, or PE, ratio is a useful yardstick because it links what investors are paying directly to the earnings the business is generating today. A higher PE can be justified when a company is expected to grow faster or is seen as lower risk, while slower growth or higher uncertainty usually calls for a lower, more conservative multiple.
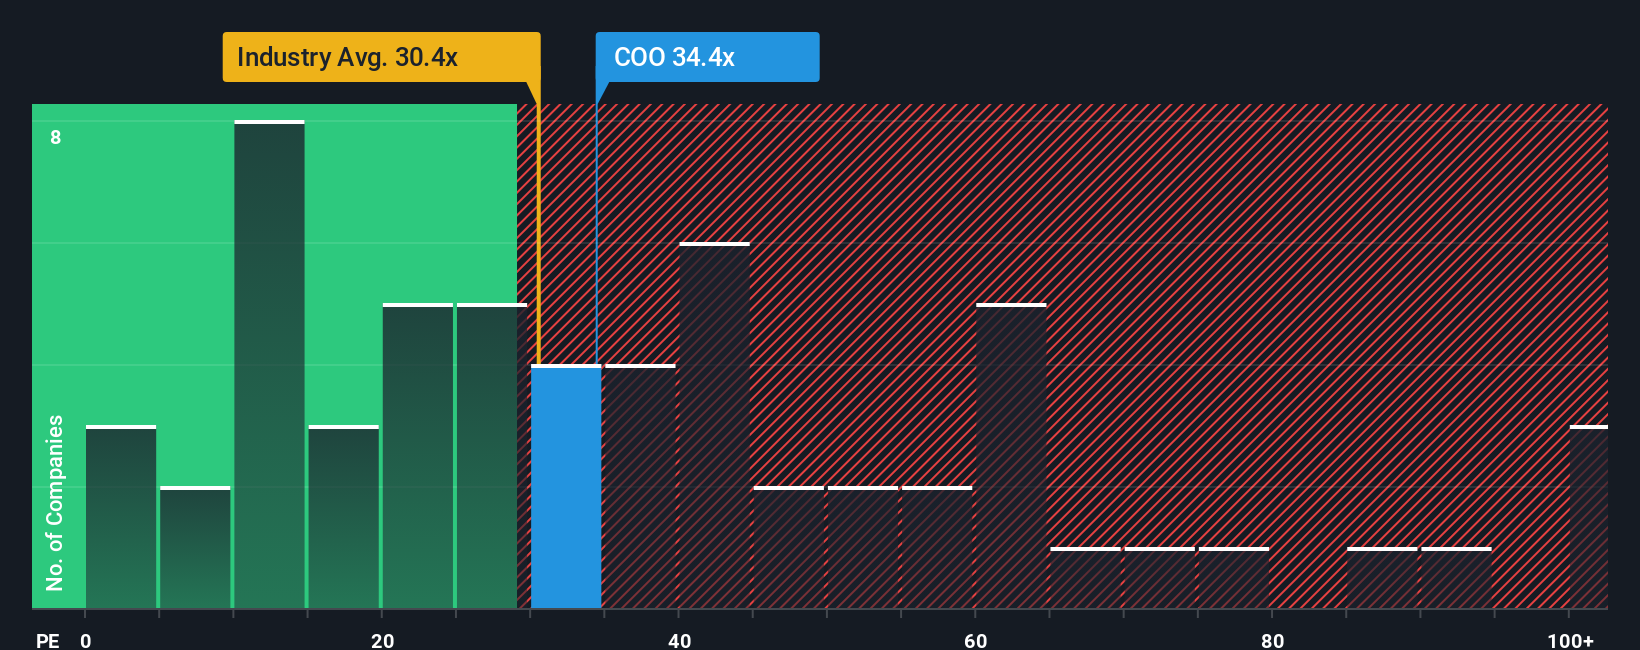
Cooper currently trades on a PE of about 42.4x, noticeably richer than both the medical equipment industry average of roughly 30.0x and the broader peer group at around 26.5x. On the surface that premium suggests the market is baking in strong growth and relatively resilient earnings.
Simply Wall St’s Fair Ratio for Cooper, at about 29.6x, goes a step further by asking what multiple would make sense given its specific mix of earnings growth, margins, industry, market cap and risk profile. This tends to be more informative than a simple peer comparison, which can overlook important differences in quality and outlook. With the actual PE sitting well above the Fair Ratio, the shares look expensive on this lens.
Result: OVERVALUED
PE ratios tell one story, but what if the real opportunity lies elsewhere? Discover 1463 companies where insiders are betting big on explosive growth.
Upgrade Your Decision Making: Choose your Cooper Companies Narrative
Earlier we mentioned that there is an even better way to understand valuation, so let's introduce you to Narratives, which are simply your story about a company, tied directly to your assumptions for its future revenue, earnings, margins and, ultimately, what you think is a fair value.
On Simply Wall St’s Community page, Narratives make this process easy and accessible by helping you link Cooper Companies underlying business story, like premium contact lens growth or activist pressure on strategy, to a structured financial forecast and then to a clear fair value that you can compare with today’s share price to decide whether it looks like a buy, a hold or a sell.
Because Narratives are updated dynamically as new information arrives, such as earnings results, guidance changes or activist news, your fair value view stays current without you having to rebuild a model from scratch.
For Cooper Companies, for example, one investor might build a more optimistic Narrative that leans on accelerating MyDAY adoption, improving margins and buybacks to support a higher fair value and larger upside to the current price. Another investor might take a cautious stance that assumes slower market growth, persistent pricing pressure and execution risks, leading to a lower fair value and a much thinner, or even negative, margin of safety.
Do you think there's more to the story for Cooper Companies? Head over to our Community to see what others are saying!

This article by Simply Wall St is general in nature. We provide commentary based on historical data and analyst forecasts only using an unbiased methodology and our articles are not intended to be financial advice. It does not constitute a recommendation to buy or sell any stock, and does not take account of your objectives, or your financial situation. We aim to bring you long-term focused analysis driven by fundamental data. Note that our analysis may not factor in the latest price-sensitive company announcements or qualitative material. Simply Wall St has no position in any stocks mentioned.
Have feedback on this article? Concerned about the content? Get in touch with us directly. Alternatively, email editorial-team@simplywallst.com