
 Nasdaq
 華爾街日報
華爾街日報Is Biogen a Mispriced Opportunity After Renewed Interest in Its Neurology Pipeline?
- If you are wondering whether Biogen is a quietly mispriced opportunity or a value trap in disguise, this breakdown walks through what the numbers are really saying about the stock.
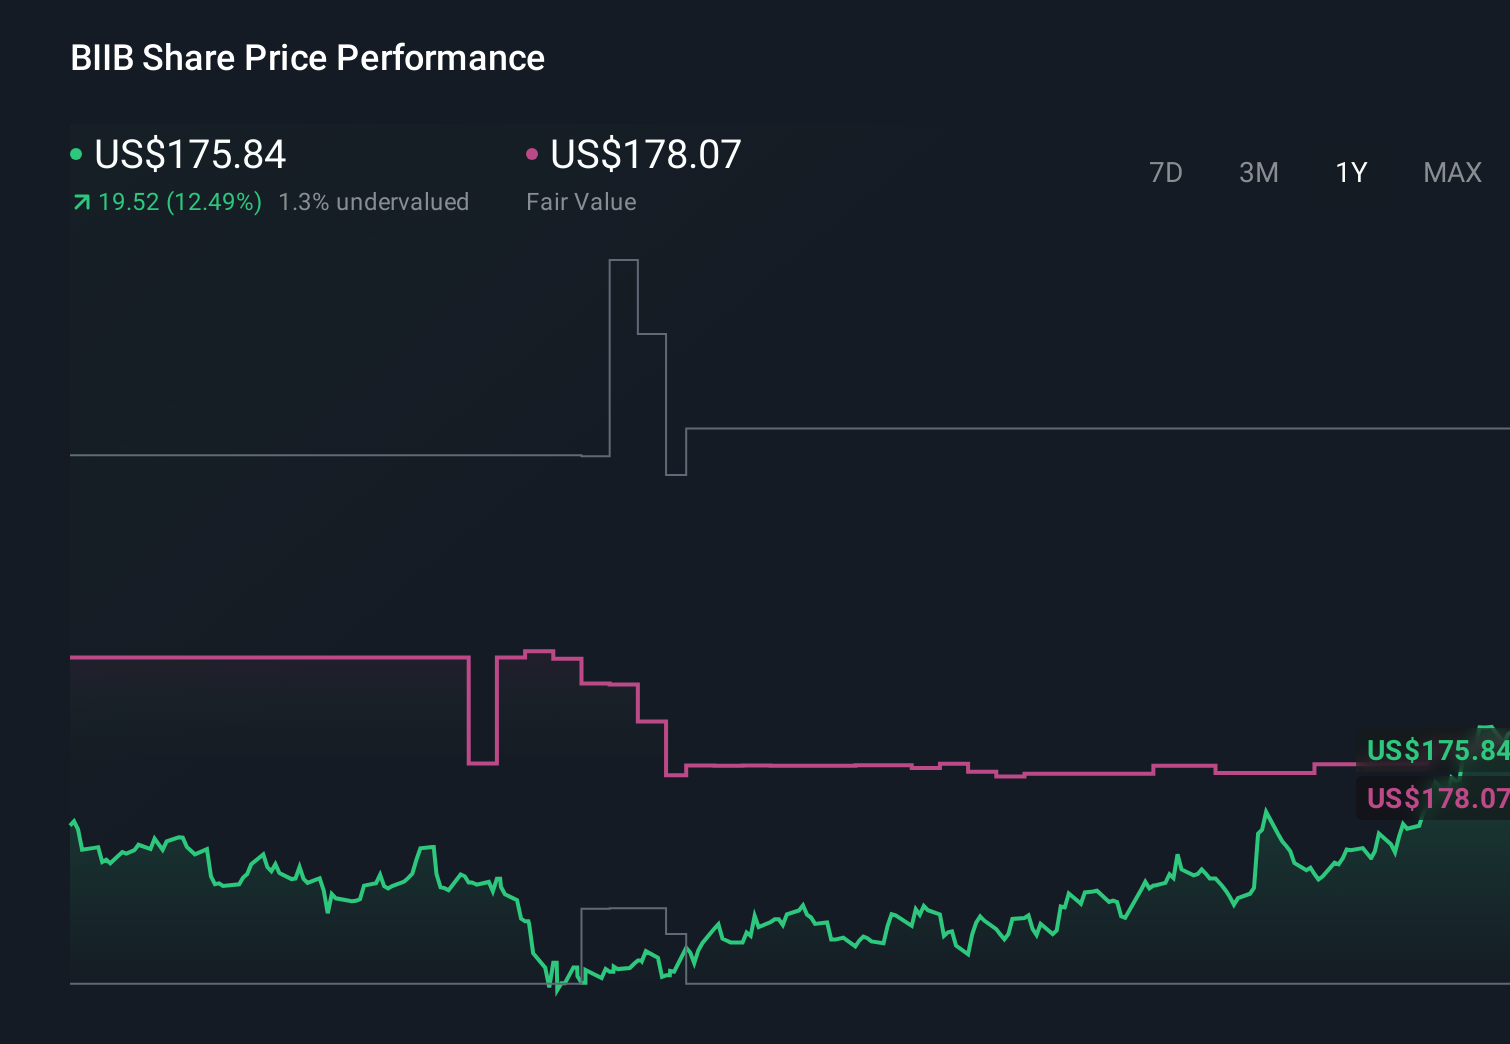
- Biogen's share price has been choppy, down 2.5% over the last week but still up 2.4% over the past month and 14.3% year to date. This pattern hints at shifting market sentiment after years of lackluster longer term returns.
- Recent headlines around Biogen have focused on its push into new neurological treatments and strategic portfolio moves, which have renewed interest in the company as a potential turnaround story. At the same time, ongoing regulatory and competitive pressures in key therapy areas are limiting how enthusiastic the market appears willing to be.
- Against that backdrop, Biogen scores a solid 5 out of 6 on our undervaluation checks. We will unpack this using multiple valuation approaches, then return to an even more insightful way of thinking about what its fair value might be.
Find out why Biogen's 13.8% return over the last year is lagging behind its peers.
Approach 1: Biogen Discounted Cash Flow (DCF) Analysis
A Discounted Cash Flow model projects the cash Biogen is expected to generate in the future, then discounts those cash flows back to today to estimate what the business is worth now.
Biogen currently generates roughly $2.18 billion in free cash flow in $. Analyst and model projections see this rising gradually over time, with free cash flow expected to be about $2.95 billion in 2035 in $. The first few years of this outlook are based on analyst estimates, while the later years are extrapolated using Simply Wall St assumptions to reflect a maturing growth profile.
When all of these projected cash flows are discounted back to today under a 2 Stage Free Cash Flow to Equity model, Simply Wall St estimates an intrinsic value of about $366 per share. Compared with the current share price, this implies the stock is roughly 53.2% undervalued, suggesting a sizeable margin of safety if the cash flow path proves broadly accurate.
Result: UNDERVALUED
Our Discounted Cash Flow (DCF) analysis suggests Biogen is undervalued by 53.2%. Track this in your watchlist or portfolio, or discover 909 more undervalued stocks based on cash flows.

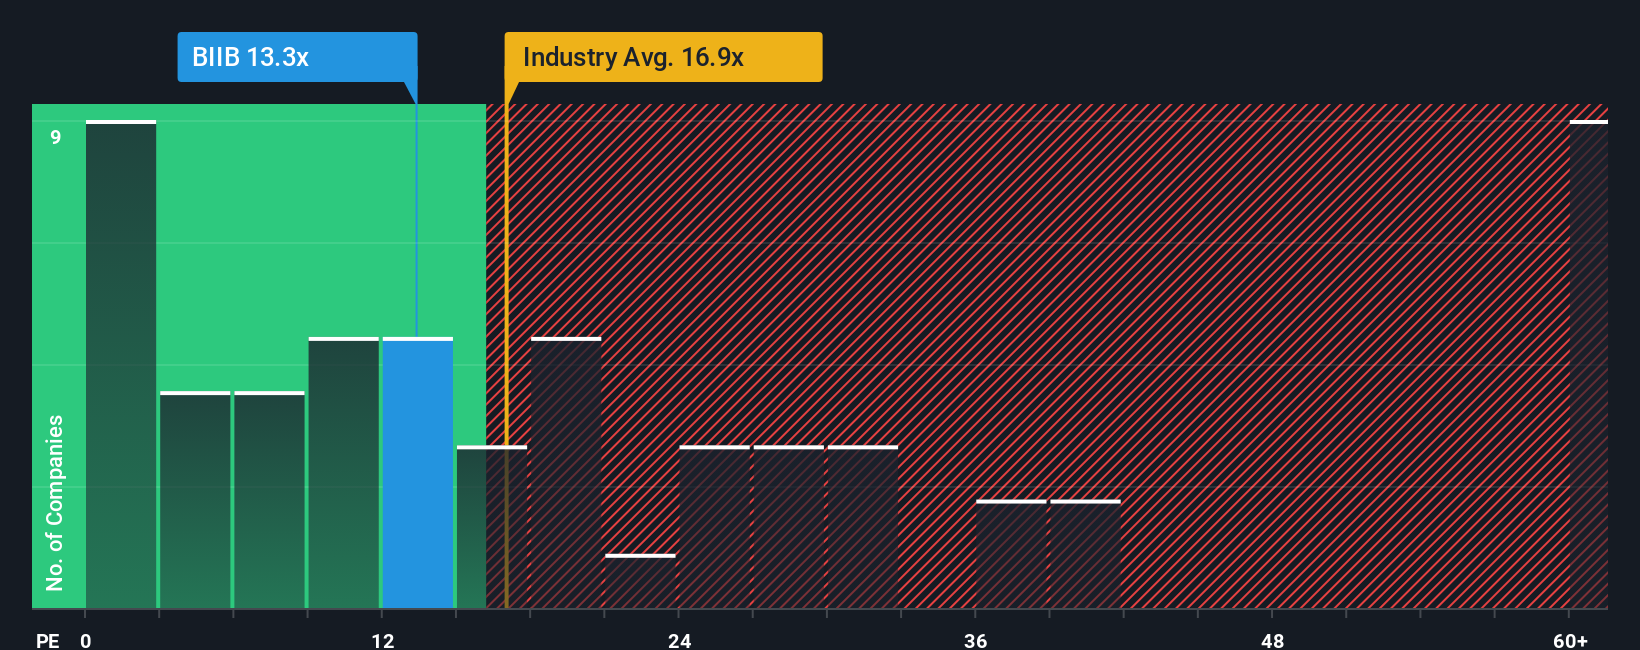
Approach 2: Biogen Price vs Earnings
For profitable companies like Biogen, the price to earnings ratio is a straightforward way to gauge how much investors are willing to pay today for each dollar of current earnings. It captures expectations about future growth and the perceived risk around those earnings in a single, intuitive number.
In general, faster growing and lower risk businesses deserve a higher PE multiple, while slower growth or higher uncertainty point to a lower, more conservative range. Biogen currently trades on a PE of about 15.6x. That sits below both the broader Biotechs industry average of roughly 18.6x and the peer group average around 21.0x, which suggests the market is applying a discount to Biogen relative to similar names.
Simply Wall St also calculates a proprietary Fair Ratio of 23.1x. This is the PE multiple Biogen might reasonably trade on given its specific mix of earnings growth, profitability, industry positioning, market cap and risk profile. This tailored yardstick is more informative than simple peer or industry comparisons because it adjusts for company level fundamentals rather than assuming all biotechs deserve the same multiple. With the Fair Ratio sitting meaningfully above the current 15.6x, the PE perspective points to Biogen looking undervalued on earnings.
Result: UNDERVALUED
PE ratios tell one story, but what if the real opportunity lies elsewhere? Discover 1463 companies where insiders are betting big on explosive growth.
Upgrade Your Decision Making: Choose your Biogen Narrative
Earlier we mentioned that there is an even better way to understand valuation, so let us introduce you to Narratives, which are simply your story about a company, translated into a set of assumptions for future revenue, earnings, margins and a resulting fair value that can be compared with today’s price.
In practice, a Narrative links what you believe about Biogen’s business, such as demand for LEQEMBI or pricing pressure in multiple sclerosis, to a structured financial forecast and then to a fair value estimate, making your investment logic explicit and testable rather than just a vague opinion.
On Simply Wall St’s Community page, used by millions of investors, Narratives are easy to create and explore, and they automatically update when new information like earnings releases, regulatory news or pipeline data arrives, so your fair value view stays aligned with reality.
For Biogen, one investor might build a bullish Narrative that leans on scenarios of stronger Alzheimer’s adoption, potential margin expansion and a fair value near the top end of analyst targets around 260 dollars. A more cautious investor might focus instead on competitive and policy risks and land closer to the low end near 128 dollars, using that range between fair value and the current share price as one input when deciding whether to buy, hold or sell.
Do you think there's more to the story for Biogen? Head over to our Community to see what others are saying!
This article by Simply Wall St is general in nature. We provide commentary based on historical data and analyst forecasts only using an unbiased methodology and our articles are not intended to be financial advice. It does not constitute a recommendation to buy or sell any stock, and does not take account of your objectives, or your financial situation. We aim to bring you long-term focused analysis driven by fundamental data. Note that our analysis may not factor in the latest price-sensitive company announcements or qualitative material. Simply Wall St has no position in any stocks mentioned.
Have feedback on this article? Concerned about the content? Get in touch with us directly. Alternatively, email editorial-team@simplywallst.com