
 Nasdaq
 華爾街日報
華爾街日報Has Corcept's 295% Three Year Surge Outrun Its Cash Flow Driven Valuation Story?
- If you have been wondering whether Corcept Therapeutics is still worth buying after its big run, you are not alone; this stock has quietly turned into one of the more intriguing valuation stories in biotech.
- The share price now sits around $81.12, with a 7.4% gain over the last month, a hefty 62.3% year to date, and a 295.3% return over three years that has clearly shifted how the market prices its future.
- Recent headlines have focused on Corcept's expanding clinical pipeline and regulatory milestones, which help explain why investors have been willing to re rate the stock despite periods of short term volatility. At the same time, growing attention from larger pharma partners and ongoing IP developments have added another layer of optimism to the long term story.
- Even after that performance, Corcept scores a 3 out of 6 on our valuation checks, suggesting pockets of undervaluation still remain. In the sections ahead we will unpack what each valuation method says about the stock and finish by looking at a more holistic way to judge whether the current price truly reflects the full narrative.
Approach 1: Corcept Therapeutics Discounted Cash Flow (DCF) Analysis
A Discounted Cash Flow model estimates what a business is worth today by projecting its future cash flows and discounting them back to a present value. For Corcept Therapeutics, the 2 Stage Free Cash Flow to Equity model starts with last twelve month free cash flow of about $162.4 Million and then layers on analyst forecasts and longer term estimates.
Analysts see free cash flow rising sharply, with projections reaching around $706.7 Million by 2029. Beyond the explicit analyst window, Simply Wall St extrapolates further, with discounted cash flows over the next decade remaining solidly positive after an initial dip in 2026. When all these future $ cash flows are added and discounted, the model arrives at an estimated value of roughly $259.75 per share.
Compared with the current share price near $81, the DCF output suggests the stock is trading at a discount of about 68.8% to this estimate, indicating that the market is not fully reflecting Corcept's projected cash generation in its current price.
Result: UNDERVALUED (based on this DCF analysis)
Our Discounted Cash Flow (DCF) analysis suggests Corcept Therapeutics is undervalued by 68.8%. Track this in your watchlist or portfolio, or discover 909 more undervalued stocks based on cash flows.
Approach 2: Corcept Therapeutics Price vs Earnings
For a profitable business like Corcept Therapeutics, the price to earnings ratio is a natural way to gauge whether investors are paying a reasonable price for each dollar of current earnings. In general, faster growth and lower perceived risk justify a higher PE, while slower or more uncertain earnings growth tends to pull a normal or fair PE lower.
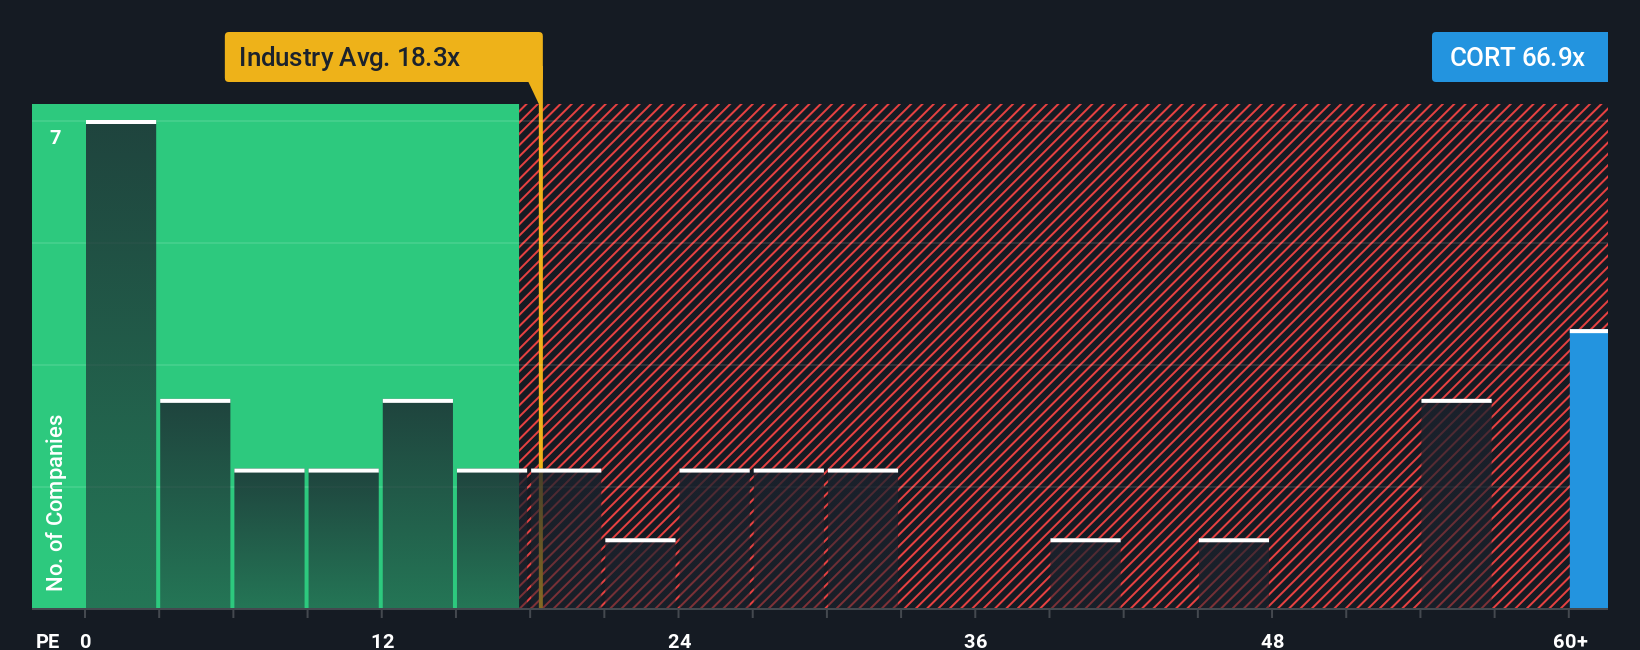
Corcept currently trades on a PE of about 81.5x, which is well above the broader Pharmaceuticals industry average of roughly 20.1x and also higher than the peer group average of around 36.8x. On those simple comparisons alone, the stock looks expensive relative to many other drug makers.
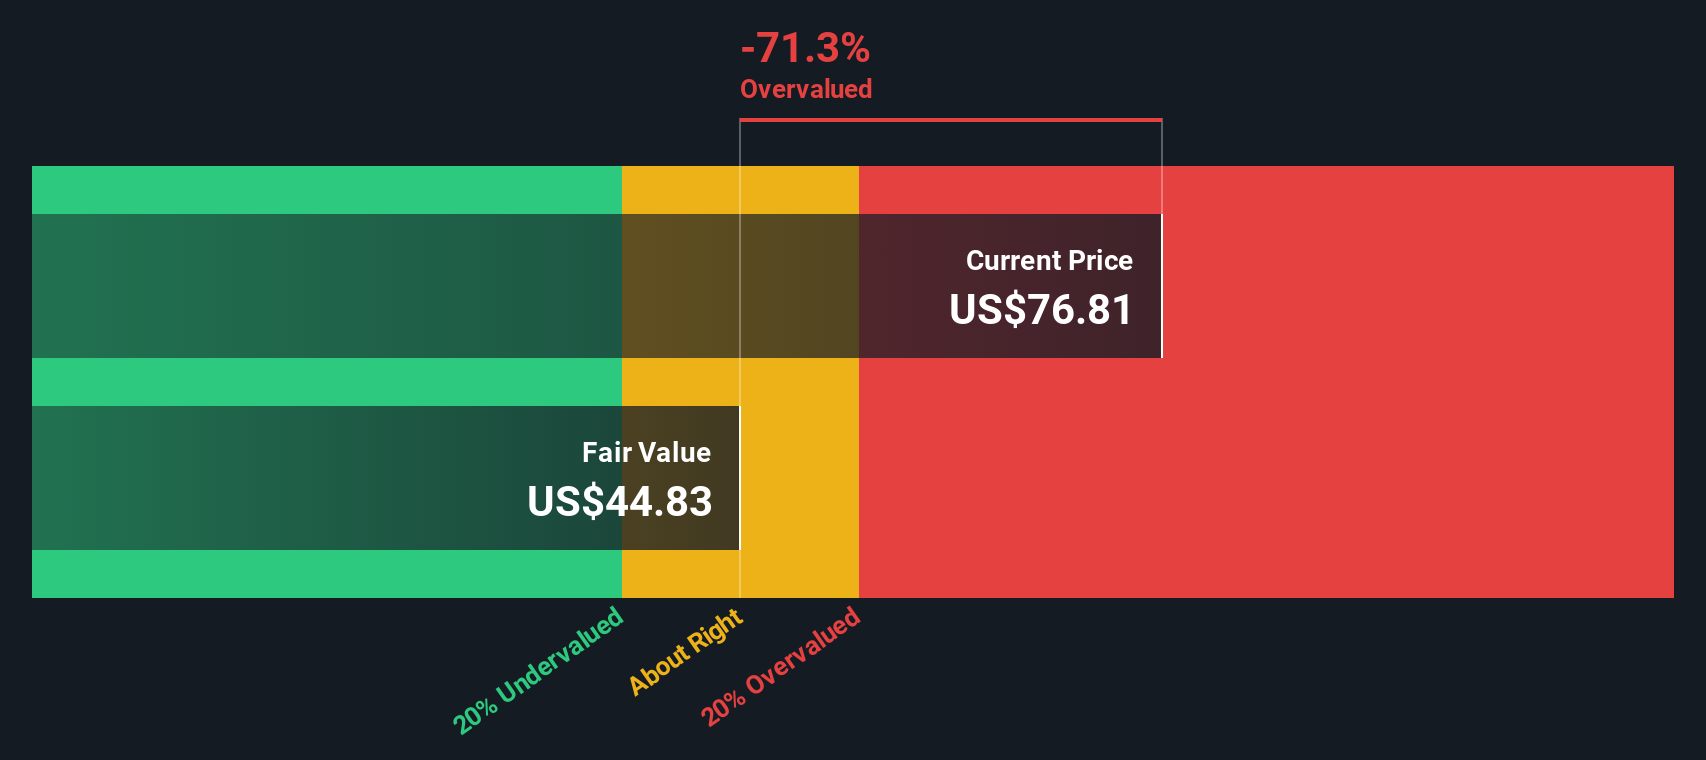
However, Simply Wall St also calculates a Fair Ratio, a proprietary PE level that reflects Corcept specific earnings growth profile, margins, industry, market cap and risk factors. This tailored benchmark, at about 44.8x for Corcept, is more informative than a blunt comparison to peers or the sector because it adjusts for what makes the company different rather than assuming all drug developers deserve the same multiple. Set against the current 81.5x PE, the Fair Ratio points to Corcept trading notably above what its fundamentals would usually warrant.
Result: OVERVALUED
PE ratios tell one story, but what if the real opportunity lies elsewhere? Discover 1463 companies where insiders are betting big on explosive growth.
Upgrade Your Decision Making: Choose Your Corcept Therapeutics Narrative
Earlier we mentioned that there is an even better way to understand valuation. Let us introduce you to Narratives, a simple framework on Simply Wall St's Community page that lets you connect your view of Corcept Therapeutics' business story to a concrete financial forecast and, ultimately, a fair value that you can compare to today’s share price to help inform a buy, hold or sell decision.
With a Narrative, you spell out your assumptions for future revenue, earnings and margins. The platform turns those into an explicit forecast and fair value estimate. That fair value is then automatically updated as new information, such as earnings results or drug approval news, comes in so your investment view evolves with the story rather than going stale.
For example, a bullish Corcept Narrative might lean on analysts’ stronger long-term growth assumptions and higher margins to support a fair value around $145 per share. A more cautious Narrative could focus on pharmacy transition and legal risks to anchor fair value closer to $121. Seeing where your own view lands between those reference points is what makes Narratives a powerful, accessible decision making tool.
Do you think there's more to the story for Corcept Therapeutics? Head over to our Community to see what others are saying!

This article by Simply Wall St is general in nature. We provide commentary based on historical data and analyst forecasts only using an unbiased methodology and our articles are not intended to be financial advice. It does not constitute a recommendation to buy or sell any stock, and does not take account of your objectives, or your financial situation. We aim to bring you long-term focused analysis driven by fundamental data. Note that our analysis may not factor in the latest price-sensitive company announcements or qualitative material. Simply Wall St has no position in any stocks mentioned.
Have feedback on this article? Concerned about the content? Get in touch with us directly. Alternatively, email editorial-team@simplywallst.com