
 Nasdaq
 華爾街日報
華爾街日報Assessing AllianceBernstein’s (AB) Valuation as the Stock Delivers a Solid 1-Year Shareholder Return
AllianceBernstein Holding (AB) has been quietly grinding higher, with the stock up about 4% over the past 3 months and roughly 23% over the past year, outpacing many traditional asset managers.
See our latest analysis for AllianceBernstein Holding.
With the share price now around $39.85 and a 30 day share price return of 1.30 percent, the steadier 1 year total shareholder return of 22.82 percent suggests momentum is still building rather than fading.
If you are weighing up where else consistent performers might be hiding, it could be worth scanning fast growing stocks with high insider ownership for your next idea.
Yet with double digit revenue growth, modest net income gains and the shares trading only slightly below analyst targets, the key question now is whether AB still offers upside or if the market already reflects its future growth.
Price to Earnings of 11.2x: Is it justified?
AllianceBernstein Holding looks inexpensive on earnings, with its 11.2x price to earnings multiple sitting alongside a last close of $39.85 and a notable discount to peers.
The price to earnings ratio compares what investors pay for each dollar of current earnings, which is especially relevant for established asset and wealth managers like AB where profitability and fee stability drive long term value.
Here, the market is applying a markedly lower multiple than both the US Capital Markets industry average of 25x and the peer average of 40.7x. Our work suggests a fair price to earnings closer to 12.5x.
The stock therefore screens as relatively attractive in valuation terms, trading at a sizeable discount to the sector and even a shade below our estimated fair earnings multiple.
Explore the SWS fair ratio for AllianceBernstein Holding
Result: Price-to-Earnings of 11.2x
However, revenue volatility, modest net income growth, and only a small discount to analyst targets could quickly challenge the case for further upside.
Find out about the key risks to this AllianceBernstein Holding narrative.
Another View on Value
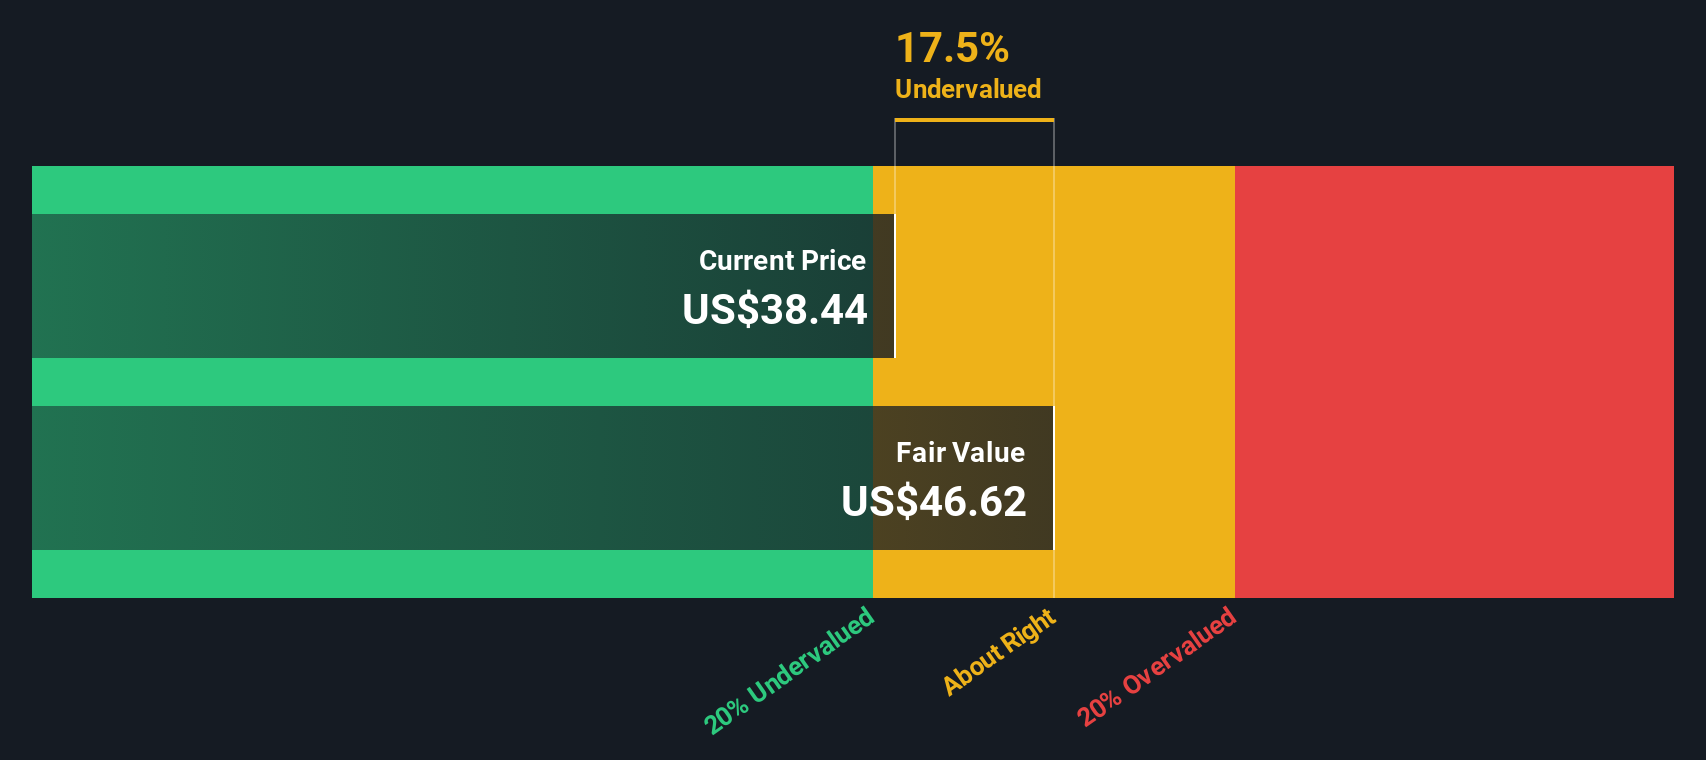
Our DCF model paints a different picture, suggesting fair value closer to $47.24, around 16 percent above the current $39.85 price. That is a bigger gap than the modest discount implied by earnings alone, raising the question: is the market underestimating AB's cash generation potential?
Look into how the SWS DCF model arrives at its fair value.
Simply Wall St performs a discounted cash flow (DCF) on every stock in the world every day (check out AllianceBernstein Holding for example). We show the entire calculation in full. You can track the result in your watchlist or portfolio and be alerted when this changes, or use our stock screener to discover 909 undervalued stocks based on their cash flows. If you save a screener we even alert you when new companies match - so you never miss a potential opportunity.
Build Your Own AllianceBernstein Holding Narrative
If you see things differently or want to dig into the numbers yourself, you can build a personalized view of AB in just minutes: Do it your way.
A great starting point for your AllianceBernstein Holding research is our analysis highlighting 3 key rewards and 3 important warning signs that could impact your investment decision.
Ready for your next investing edge?
Do not stop at one opportunity. Put Simply Wall Street's powerful screener to work and uncover more stocks that could sharpen and strengthen your portfolio today.
- Boost your income potential by targeting dependable payers through these 13 dividend stocks with yields > 3% that can complement AB in a yield focused strategy.
- Capitalize on innovation by scanning these 26 AI penny stocks for companies turning artificial intelligence momentum into real revenue growth.
- Strengthen your margin of safety by zeroing in on these 909 undervalued stocks based on cash flows that the market may be mispricing right now.
This article by Simply Wall St is general in nature. We provide commentary based on historical data and analyst forecasts only using an unbiased methodology and our articles are not intended to be financial advice. It does not constitute a recommendation to buy or sell any stock, and does not take account of your objectives, or your financial situation. We aim to bring you long-term focused analysis driven by fundamental data. Note that our analysis may not factor in the latest price-sensitive company announcements or qualitative material. Simply Wall St has no position in any stocks mentioned.
Have feedback on this article? Concerned about the content? Get in touch with us directly. Alternatively, email editorial-team@simplywallst.com