
 Nasdaq
 華爾街日報
華爾街日報Is It Too Late to Invest in Huntington Ingalls After Its 2025 Share Price Surge?
- Wondering if Huntington Ingalls Industries is still a smart buy after its big run, or if the market has already priced in the upside? This breakdown will walk through what the current share price really implies.
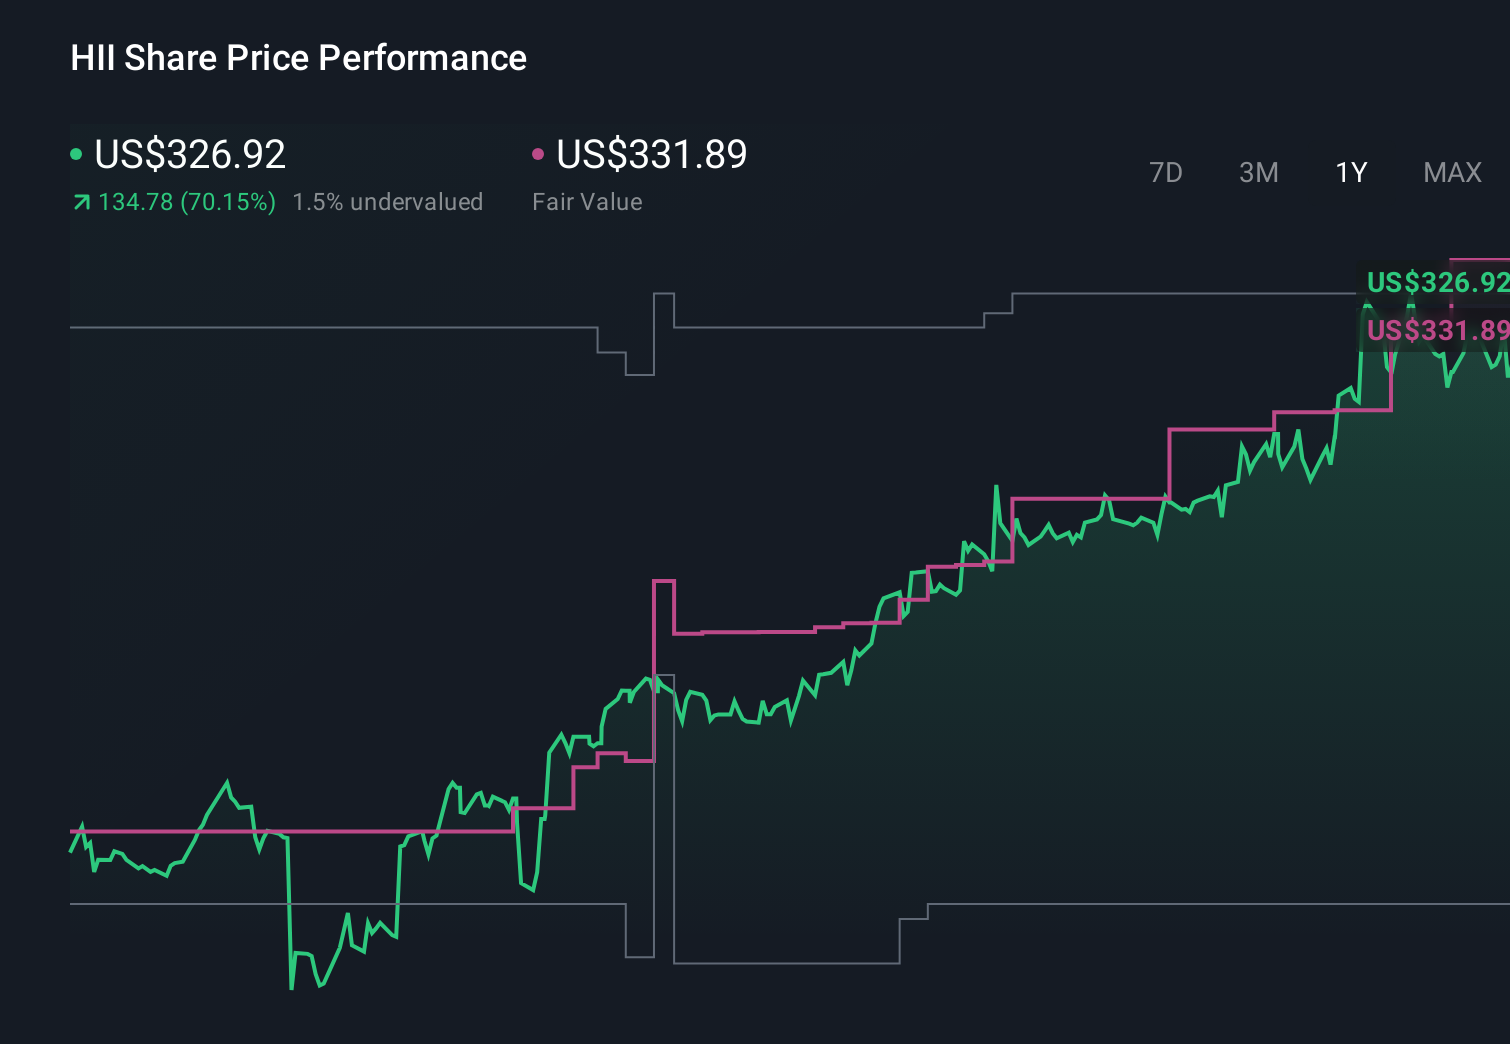
- The stock has climbed to around $326.80, with gains of 3.8% over the last week, 4.1% over the last month, and 74.2% year to date, building on a 72.9% 1-year return and 123.6% over 5 years that has clearly shifted how investors see its prospects and risks.
- That re-rating has been helped by steady contract wins in key U.S. Navy programs and ongoing optimism around long-term defense spending, which investors see as adding visibility to Huntington Ingalls Industries’ future cash flows. At the same time, heightened geopolitical tensions and renewed focus on naval capabilities have kept shipbuilders like HII in the spotlight as potential long-duration growth and cash generation stories.
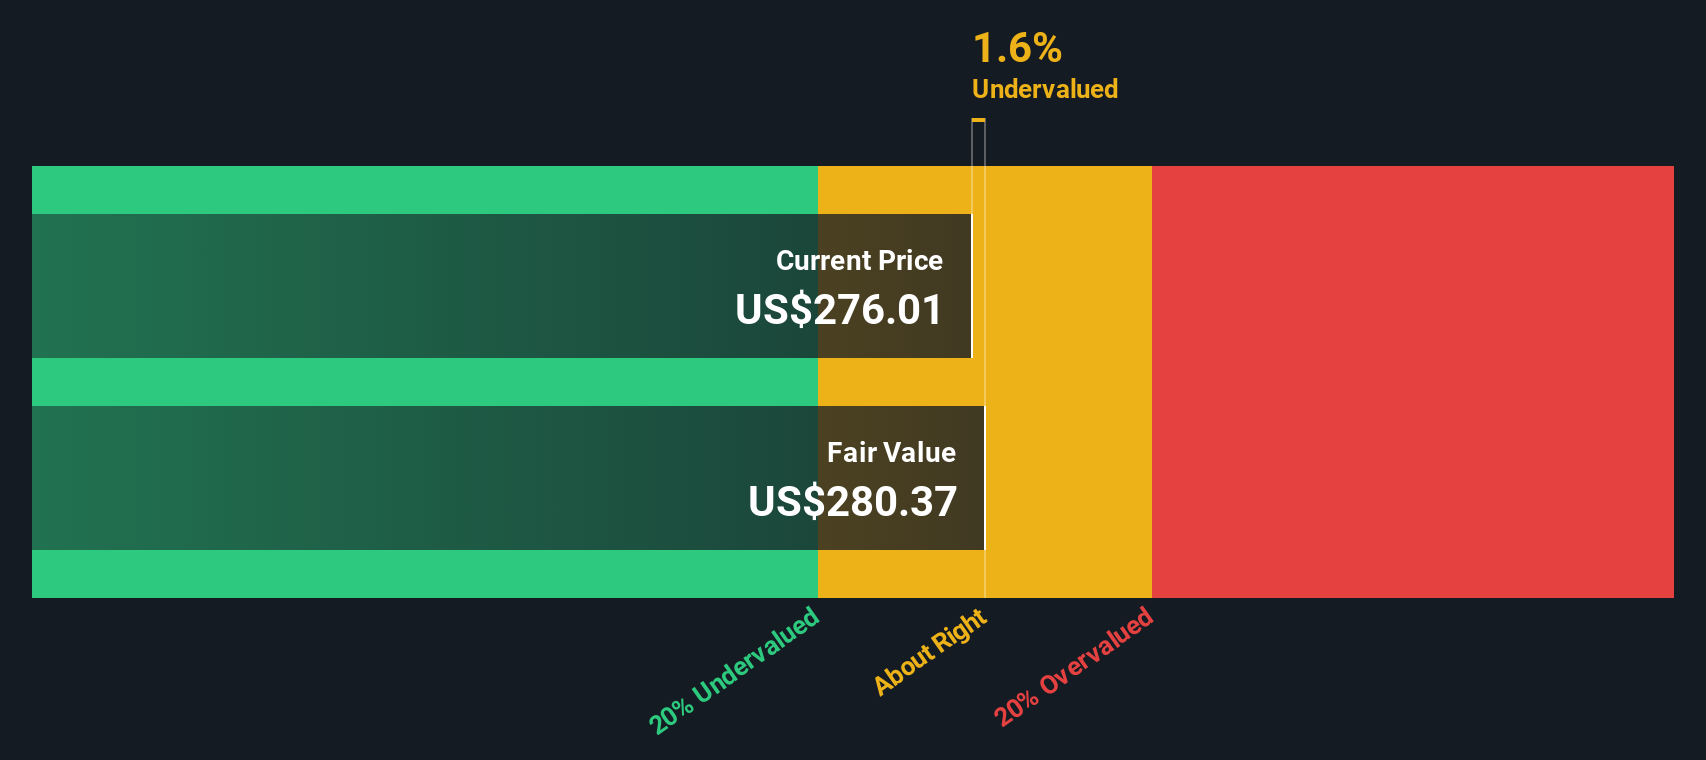
- Even after this run, Huntington Ingalls Industries posts a valuation score of 5/6, suggesting the market may still be underestimating parts of its intrinsic value. Next, we will unpack what different valuation approaches are saying about the stock today, and then finish with an additional way to think about what fair value really means for long-term investors.
Approach 1: Huntington Ingalls Industries Discounted Cash Flow (DCF) Analysis
A Discounted Cash Flow model estimates what a business is worth today by projecting the cash it can generate in the future and discounting those cash flows back to the present.
For Huntington Ingalls Industries, the latest twelve month Free Cash Flow is about $580.9 million. Analysts and extrapolated estimates see this rising steadily, with projected Free Cash Flow reaching roughly $1.17 billion by 2035, based on a 2 stage Free Cash Flow to Equity model that blends near term analyst forecasts with longer term growth assumptions from Simply Wall St.
Adding up these future cash flows and discounting them back to today yields an estimated intrinsic value of about $451.60 per share. Compared with the current share price around $326.80, the DCF suggests the stock is roughly 27.6% undervalued. This implies the market may not be fully pricing in Huntington Ingalls Industries future cash generation.
Result: UNDERVALUED
Our Discounted Cash Flow (DCF) analysis suggests Huntington Ingalls Industries is undervalued by 27.6%. Track this in your watchlist or portfolio, or discover 909 more undervalued stocks based on cash flows.
Approach 2: Huntington Ingalls Industries Price vs Earnings
For a mature, consistently profitable business like Huntington Ingalls Industries, the price to earnings ratio is a practical way to gauge what investors are paying for each dollar of current profits. In general, faster earnings growth and lower perceived risk justify a higher PE multiple, while slower growth and higher uncertainty usually call for a lower one.
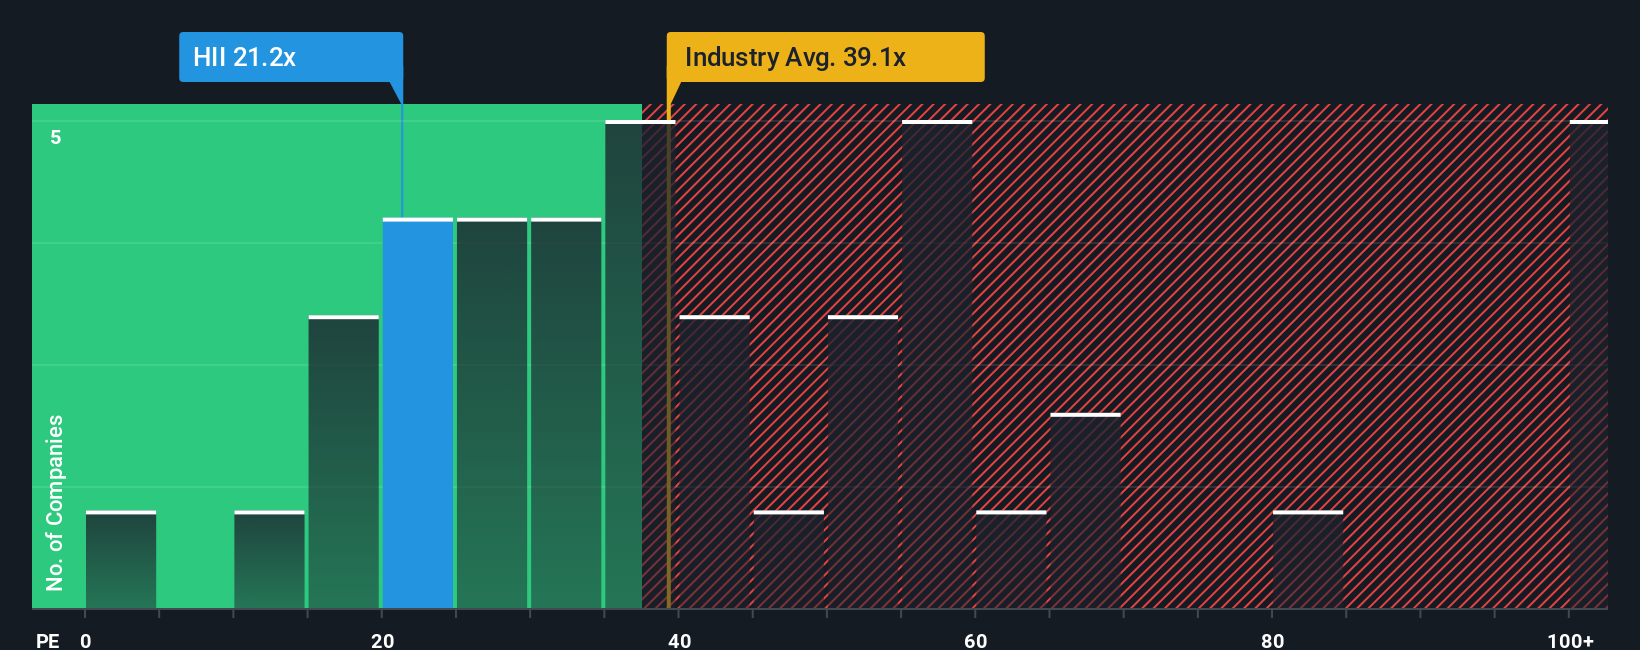
Huntington Ingalls Industries currently trades on a PE of about 22.5x, which sits well below the Aerospace and Defense industry average of roughly 37.4x and also under the peer group average of around 35.5x. Rather than stopping at simple comparisons, Simply Wall St uses a proprietary Fair Ratio that estimates what a suitable PE should be once factors like earnings growth, profit margins, risk profile, industry, and market cap are all accounted for.
For Huntington Ingalls Industries, that Fair Ratio comes out at about 26.2x, notably higher than the current 22.5x multiple. This suggests the market is applying a discount relative to what its fundamentals might justify, which may point to additional upside if earnings continue to deliver.
Result: UNDERVALUED
PE ratios tell one story, but what if the real opportunity lies elsewhere? Discover 1463 companies where insiders are betting big on explosive growth.
Upgrade Your Decision Making: Choose your Huntington Ingalls Industries Narrative
Earlier we mentioned that there is an even better way to understand valuation, so let us introduce you to Narratives, a simple way to attach your story about Huntington Ingalls Industries to the numbers. You can link what you believe about its future revenue, earnings and margins to a financial forecast and, ultimately, to a fair value estimate that you can compare with today’s share price to decide whether to buy, hold or sell. All of this happens inside Simply Wall St’s Community page, where millions of investors share perspectives that are automatically updated as new news and earnings arrive.
One investor might build a bullish Narrative that emphasizes sustained defense budget growth, backlog visibility and operational improvements that justify a fair value well above the current price. Another might create a more cautious Narrative that stresses contract timing risk, supply chain challenges and political uncertainty, leading to a much lower fair value. By exploring this range of Narratives for Huntington Ingalls Industries, you can quickly see how different assumptions drive different valuations and then choose, refine, or build the one that best matches your own view.
Do you think there's more to the story for Huntington Ingalls Industries? Head over to our Community to see what others are saying!
This article by Simply Wall St is general in nature. We provide commentary based on historical data and analyst forecasts only using an unbiased methodology and our articles are not intended to be financial advice. It does not constitute a recommendation to buy or sell any stock, and does not take account of your objectives, or your financial situation. We aim to bring you long-term focused analysis driven by fundamental data. Note that our analysis may not factor in the latest price-sensitive company announcements or qualitative material. Simply Wall St has no position in any stocks mentioned.
Have feedback on this article? Concerned about the content? Get in touch with us directly. Alternatively, email editorial-team@simplywallst.com