
 Nasdaq
 華爾街日報
華爾街日報Has NGL Energy Partners’ Triple Digit Run in 2025 Already Priced In the Upside?
- Wondering if NGL Energy Partners is still a bargain after such a massive run up, or if most of the easy money has already been made? This is exactly the kind of stock where valuation really matters.
- The unit price has cooled slightly in the short term, down around 3.2% over the last week and 2.1% over the past month, but it is still up about 85.7% year to date and roughly 100% over the last year, with a 736.5% gain over three years.
- Those kinds of moves have been driven by a mix of improving balance sheet progress and investor optimism around midstream and water solutions demand, which has put more attention on higher yielding energy infrastructure names. In addition, sector wide rotation into income focused energy plays has made NGL part of a broader search for cash flow and stability rather than purely speculative growth.
- Even after that run, NGL Energy Partners only scores 2/6 on our undervaluation checks. The numbers are sending a mixed message that we will unpack by looking at cash flows, asset based metrics, and market multiples, before circling back at the end to a more complete way of thinking about what this valuation means for long term investors.
NGL Energy Partners scores just 2/6 on our valuation checks. See what other red flags we found in the full valuation breakdown.
Approach 1: NGL Energy Partners Dividend Discount Model (DDM) Analysis
The Dividend Discount Model estimates what a stock should be worth today by projecting all future dividend payments and discounting them back to the present.
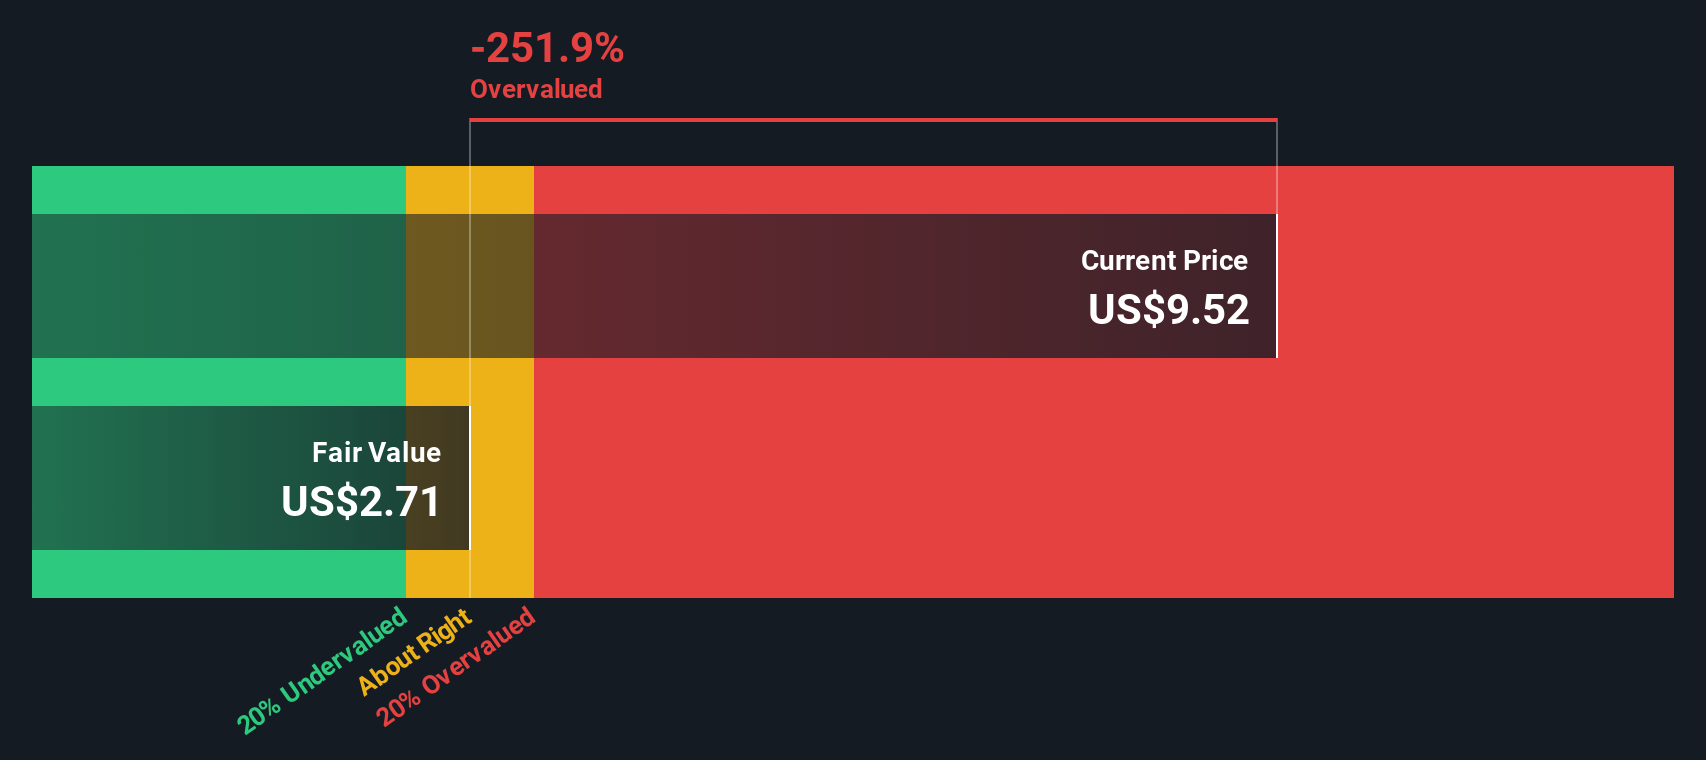
For NGL Energy Partners, the model uses a current dividend per unit of $0.10 and a modest long term dividend growth rate of 3.26%, capped down from a higher raw estimate to avoid overly aggressive assumptions. The framework also considers a high reported return on equity of 3.73 and an unusual, negative payout ratio of roughly -124%, which indicates that current dividends are not well aligned with underlying earnings and cash flows.
Based on these dividend projections, the model arrives at an intrinsic value of about $2.71 per unit. Compared with the current market price, this indicates that the units are roughly 255.6% overvalued. This suggests that investors may be paying significantly more for the current distribution stream than what the DDM output supports under these assumptions.
Result: OVERVALUED
Our Dividend Discount Model (DDM) analysis suggests NGL Energy Partners may be overvalued by 255.6%. Discover 915 undervalued stocks or create your own screener to find better value opportunities.
Approach 2: NGL Energy Partners Price vs Sales
For businesses that are still normalizing earnings but generating meaningful revenue, the price to sales ratio can be a useful way to gauge what investors are paying for each dollar of turnover. In general, higher growth and stronger perceived stability can justify a richer sales multiple, while slower growth or elevated risk should pull that multiple down toward a more conservative range.
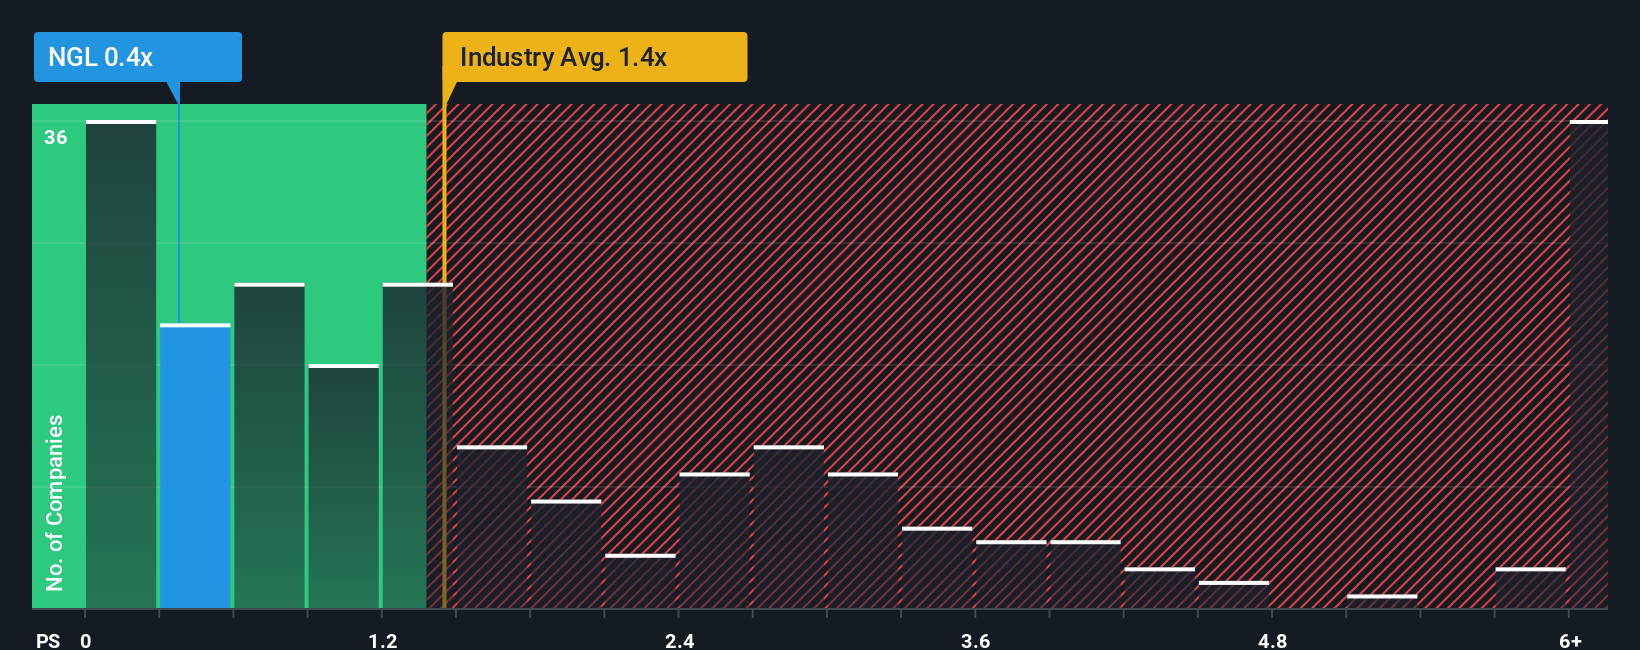
NGL Energy Partners currently trades at about 0.37x sales. That is well below the broader Oil and Gas industry average of roughly 1.44x and also sits under the peer group average of about 1.91x. However, Simply Wall St’s Fair Ratio for NGL, at around 0.29x sales, is tailored specifically to the partnership’s growth outlook, profitability profile, industry positioning, size, and risk factors.
This Fair Ratio provides a more nuanced benchmark than simple industry or peer comparisons, because it adjusts for company specific dynamics rather than assuming all midstream and water infrastructure names deserve the same multiple. With NGL’s actual price to sales ratio modestly above the 0.29x Fair Ratio, the units screen as slightly overvalued on this metric.
Result: OVERVALUED
PS ratios tell one story, but what if the real opportunity lies elsewhere? Discover 1460 companies where insiders are betting big on explosive growth.
Upgrade Your Decision Making: Choose your NGL Energy Partners Narrative
Earlier we mentioned that there is an even better way to understand valuation, so let us introduce you to Narratives, a simple way to connect your view of NGL Energy Partners with the numbers behind it. A Narrative is your story about the business, where you spell out what you think will happen to its revenue, earnings and margins, and then translate that into a financial forecast and a fair value estimate. On Simply Wall St, Narratives are an easy, guided tool on the Community page that millions of investors use to turn broad opinions into structured, comparable valuations. Once you have a Narrative, you can quickly see whether your Fair Value sits above or below today’s unit price. This can help you decide whether NGL looks like a buy, hold, or sell. Narratives also update dynamically when fresh news, earnings, or guidance arrives, so your valuation can evolve as the story changes. For example, one NGL Narrative might assume strong water solutions growth and assign a much higher fair value than another Narrative that expects slower volumes and a lower long term margin profile.
Do you think there's more to the story for NGL Energy Partners? Head over to our Community to see what others are saying!

This article by Simply Wall St is general in nature. We provide commentary based on historical data and analyst forecasts only using an unbiased methodology and our articles are not intended to be financial advice. It does not constitute a recommendation to buy or sell any stock, and does not take account of your objectives, or your financial situation. We aim to bring you long-term focused analysis driven by fundamental data. Note that our analysis may not factor in the latest price-sensitive company announcements or qualitative material. Simply Wall St has no position in any stocks mentioned.
Have feedback on this article? Concerned about the content? Get in touch with us directly. Alternatively, email editorial-team@simplywallst.com