
 Nasdaq
 華爾街日報
華爾街日報Is It Too Late To Consider Wells Fargo After A 31% Rally In 2025?
- If you are wondering whether Wells Fargo is still a value play after such a big run up, or if you might be arriving late to the party, this breakdown is for you.
- The stock has climbed 3.7% over the last week, 8.4% over the past month, and is now up 31.3% year to date and 33.0% over the last 12 months. That caps a multi year rebound of 143.3% over 3 years and 257.2% over 5 years.
- That surge has come as investors have steadily warmed back up to big US banks, with sentiment improving around credit quality, interest rate expectations, and capital return plans. At the same time, regulatory overhangs and restructuring efforts at Wells Fargo have kept the story in the headlines and reminded investors that this is still not a risk free turnaround.
- Despite the strong share price performance, Wells Fargo only scores a 2 out of 6 on our valuation checks, suggesting the market may already be pricing in a lot of good news. Next, we will walk through the main valuation approaches investors use and then finish with a more complete way to think about what the stock might be worth.
Wells Fargo scores just 2/6 on our valuation checks. See what other red flags we found in the full valuation breakdown.
Approach 1: Wells Fargo Excess Returns Analysis
The Excess Returns model estimates what Wells Fargo can earn above its cost of equity over time, based on how efficiently it reinvests shareholder capital and grows book value.
For Wells Fargo, the starting point is a Book Value of $52.25 per share and a Stable Book Value of $56.16 per share, based on weighted future estimates from 14 analysts. Using an Average Return on Equity of 13.04%, analysts infer a Stable EPS of $7.32 per share, sourced from 17 analysts. Against a Cost of Equity of $4.60 per share, this implies an Excess Return of $2.72 per share that the bank can generate on its equity base.
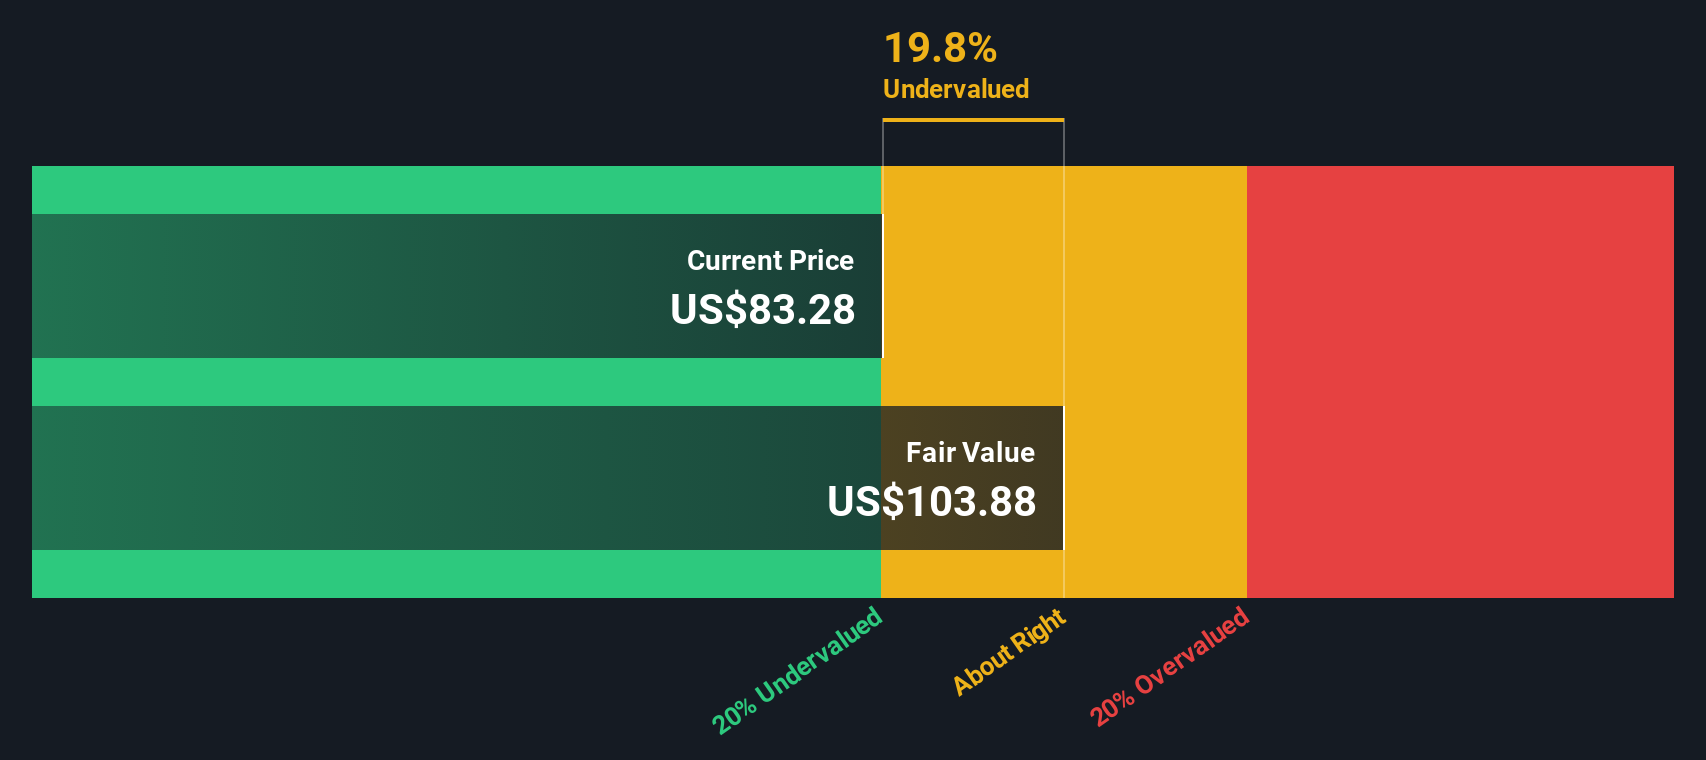
Aggregating these excess returns over time and discounting them back gives an intrinsic value estimate of about $111.34 per share. Compared with the current share price, this implies the stock is roughly 17.2% undervalued, which indicates that the market may not yet be fully rewarding the bank for its expected profitability on equity.
Result: UNDERVALUED
Our Excess Returns analysis suggests Wells Fargo is undervalued by 17.2%. Track this in your watchlist or portfolio, or discover 915 more undervalued stocks based on cash flows.
Approach 2: Wells Fargo Price vs Earnings
For a consistently profitable bank like Wells Fargo, the price to earnings ratio is a useful way to judge value because it ties the share price directly to the profits shareholders are paying for today. In general, faster growth and lower perceived risk justify a higher normal PE, while slower growth or higher risk usually mean the multiple should sit closer to, or below, the market and industry averages.
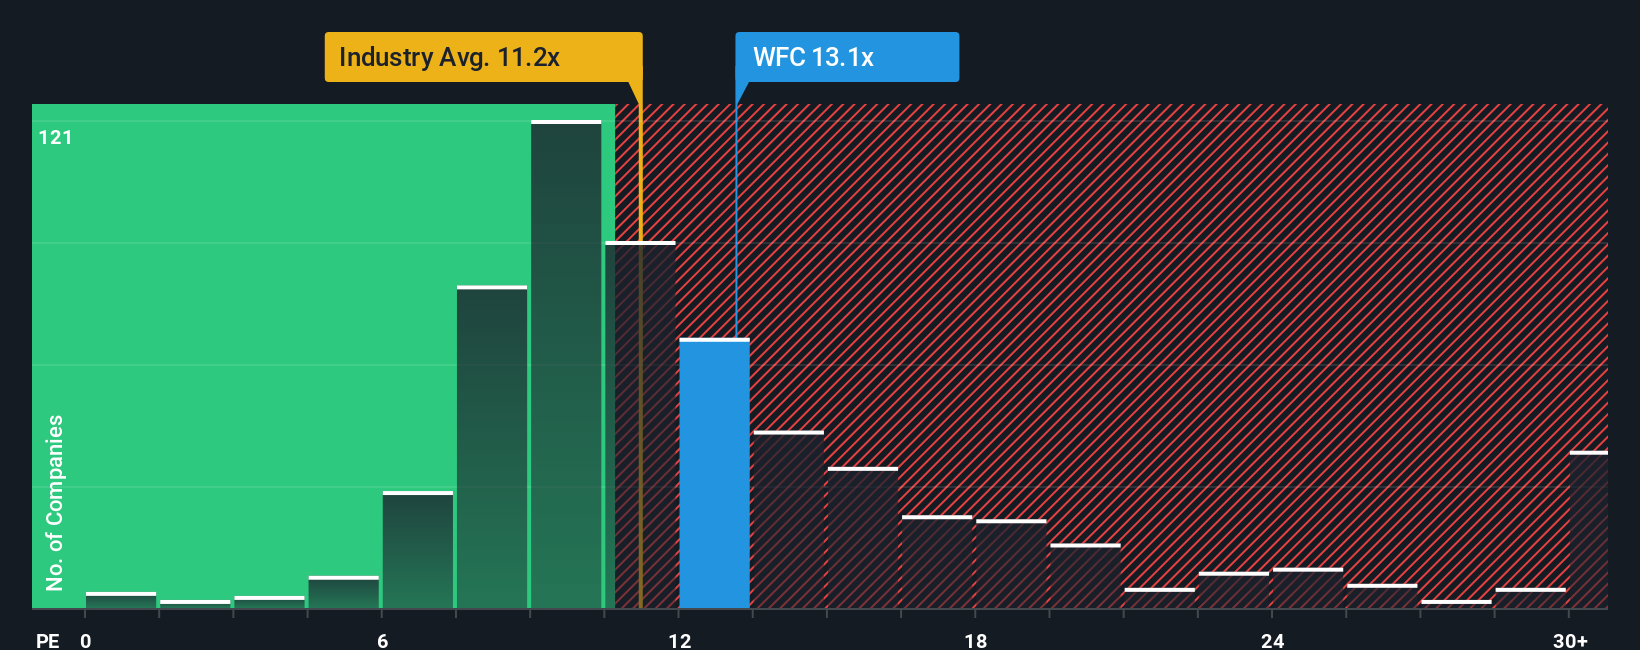
Wells Fargo currently trades at about 14.49x earnings, above the broader Banks industry average of 11.97x but only modestly higher than the peer group average of 13.64x. Simply Wall St goes a step further by estimating a Fair Ratio of 15.59x, which reflects what investors might reasonably pay given Wells Fargo earnings growth outlook, profitability, size, industry positioning and risk profile.
This Fair Ratio is more tailored than a simple peer or industry comparison, because it explicitly adjusts for company specific drivers such as margins, growth and risk rather than assuming all banks deserve the same multiple. Comparing 14.49x to the 15.59x Fair Ratio suggests the market is applying a small discount to what might be considered a normal valuation for Wells Fargo.
Result: UNDERVALUED
PE ratios tell one story, but what if the real opportunity lies elsewhere? Discover 1460 companies where insiders are betting big on explosive growth.
Upgrade Your Decision Making: Choose your Wells Fargo Narrative
Earlier we mentioned that there is an even better way to understand valuation, so let us introduce you to Narratives, a simple way to connect the story you believe about Wells Fargo with a concrete forecast for its revenue, earnings, margins and ultimately its fair value.
A Narrative is your investment storyline backed by numbers, where you spell out how you think the business will grow, what risks matter most, and how that translates into a financial forecast which then gives you a Fair Value you can compare with today’s share price to help inform your decision to buy, hold, or sell.
On Simply Wall St, Narratives are an easy, accessible tool used by millions of investors via the Community page. They update dynamically whenever major news, earnings releases, or guidance changes shift the outlook so that your view and the embedded Fair Value move with the latest information.
For Wells Fargo, for example, one investor Narrative might see fair value around $74.70 based on more modest growth and margins. Another might see fair value closer to $94.50 on stronger fee income and improving profitability. Narratives make those different perspectives transparent and comparable in one place.
For Wells Fargo, here are previews of two leading Wells Fargo Narratives for you to review:
Fair value: $94.50 per share
Implied undervaluation vs last close: 2.4%
Forecast revenue growth: 6.94%
- Analysts expect balance sheet growth, digital adoption, and wealth management expansion to support fee driven revenue growth and stronger long term profitability.
- Efficiency gains from expense discipline and technology investment, including early AI initiatives, are expected to lift margins and returns on equity over time.
- Key risks include fierce competition, ongoing regulatory and compliance burdens, shifting customer behavior toward digital first rivals, and an uncertain interest rate backdrop.
Fair value: $74.70 per share
Implied overvaluation vs last close: 23.4%
Forecast revenue growth: 3.0%
- Views Wells Fargo as fundamentally sound with a wide customer base, low funding costs, and long term competitive advantages in core banking.
- Argues that near term growth is only moderate and heavily exposed to macro headwinds in housing and manufacturing, which tempers the upside case.
- Sees the current share price as rich relative to intrinsic value, with future upside depending on regulatory relief, consistent execution, and sustained earnings growth.
Putting these side by side, your next step is to decide which storyline feels more realistic, adjust the assumptions as you see fit, and then compare your own fair value with today’s price before making any move on Wells Fargo.
Do you think there's more to the story for Wells Fargo? Head over to our Community to see what others are saying!

This article by Simply Wall St is general in nature. We provide commentary based on historical data and analyst forecasts only using an unbiased methodology and our articles are not intended to be financial advice. It does not constitute a recommendation to buy or sell any stock, and does not take account of your objectives, or your financial situation. We aim to bring you long-term focused analysis driven by fundamental data. Note that our analysis may not factor in the latest price-sensitive company announcements or qualitative material. Simply Wall St has no position in any stocks mentioned.
Have feedback on this article? Concerned about the content? Get in touch with us directly. Alternatively, email editorial-team@simplywallst.com