
 Nasdaq
 華爾街日報
華爾街日報Has the Recent Rally Left Delta Stock Still Attractively Priced in 2025?
- Wondering if Delta Air Lines is still good value after its latest run up, or if the easy money has already been made? This breakdown walks through what the numbers are really saying about the stock.
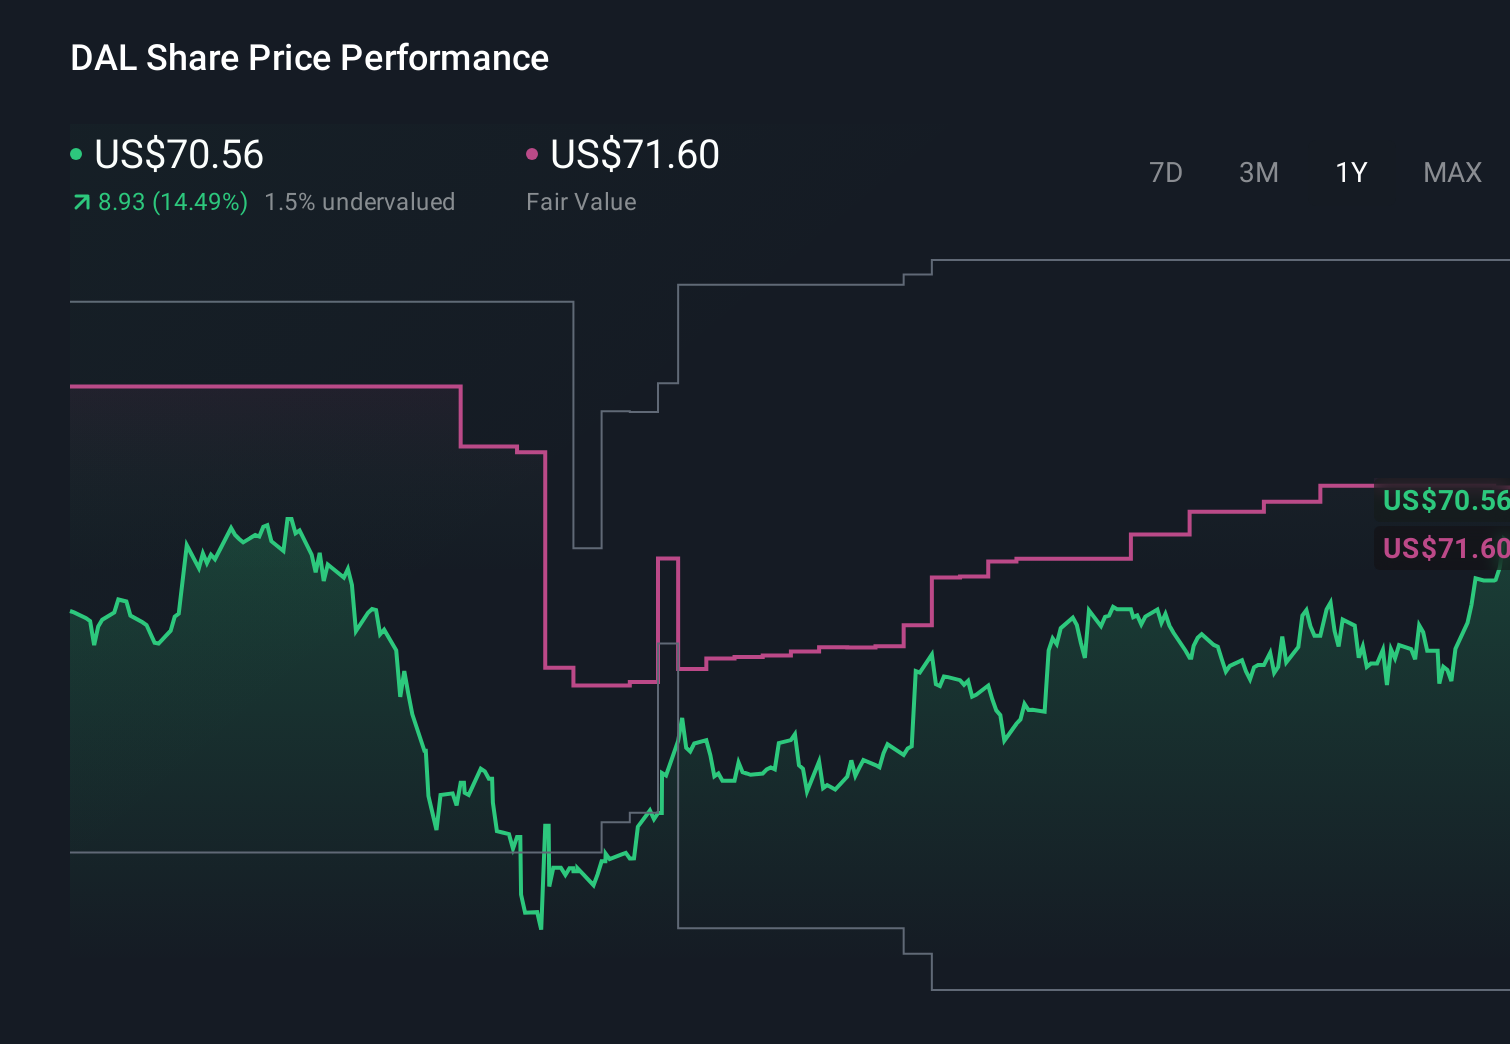
- Delta shares have climbed 5.5% over the last week, 21.8% over the past month, and are now up 20.4% year to date, building on gains of 18.4% over 1 year and 122.3% over 3 years.
- Recently, investors have been reacting to stronger travel demand, improving capacity on key international routes, and industry wide optimism around premium and corporate travel recovering. At the same time, macro headlines around moderating fuel prices and stabilizing inflation have helped shift sentiment toward airlines as a group.
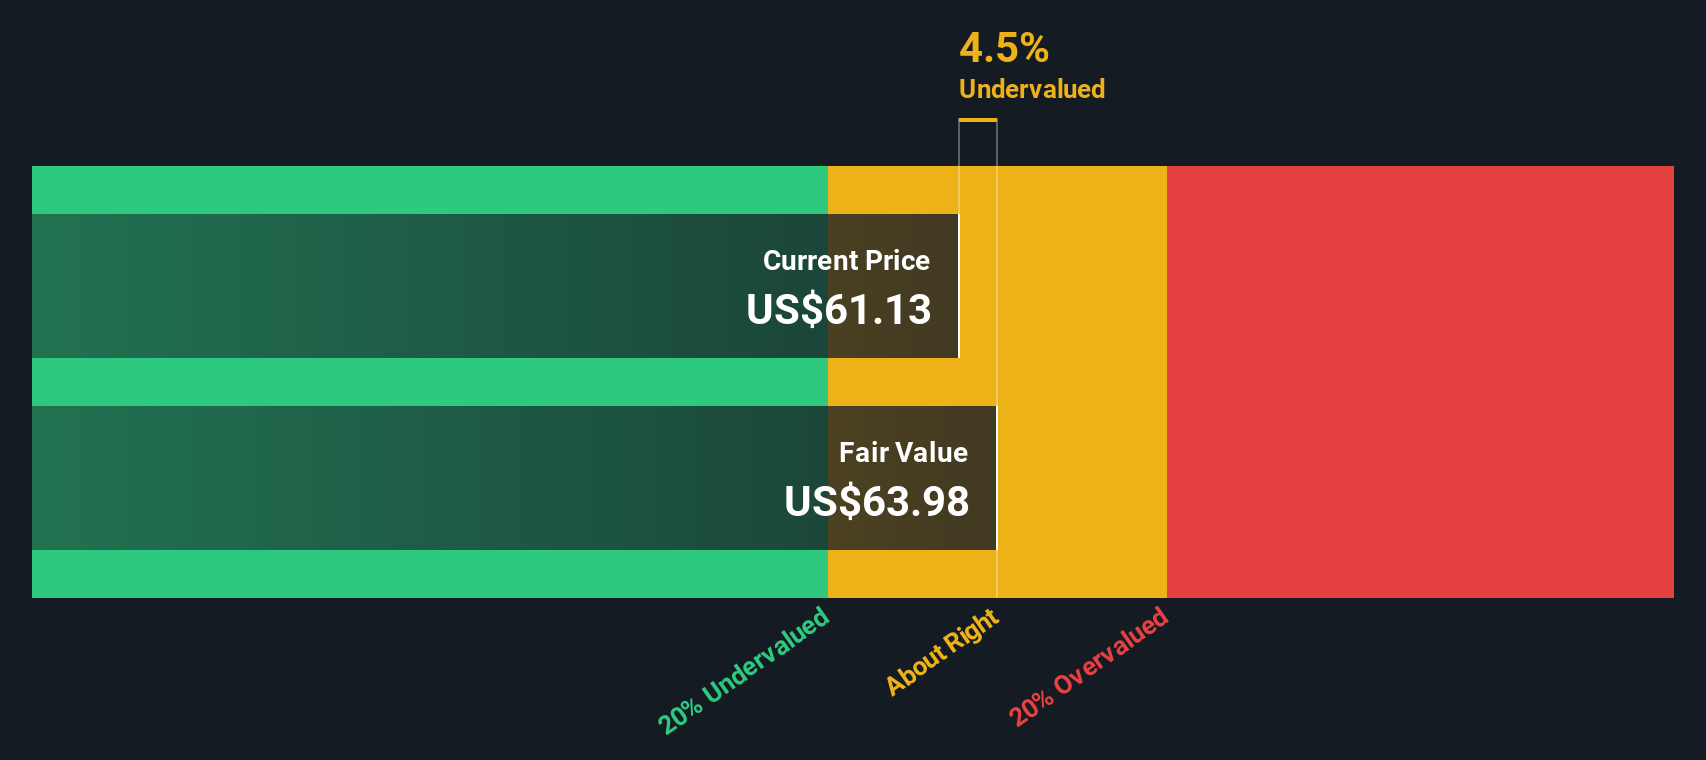
- Right now, Delta scores a 4/6 valuation score, suggesting it screens as undervalued on most of the checks used here. Next, this breakdown will unpack what that means across different valuation approaches, before ending with a more practical way to think about what the stock may be worth.
Find out why Delta Air Lines's 18.4% return over the last year is lagging behind its peers.
Approach 1: Delta Air Lines Discounted Cash Flow (DCF) Analysis
A Discounted Cash Flow model estimates what a business is worth by projecting its future cash flows and then discounting those back into today’s dollars. For Delta Air Lines, the model starts with last twelve month Free Cash Flow of about $2.3 billion and uses analyst forecasts for the next few years, then extrapolates trends further out.
Under this 2 Stage Free Cash Flow to Equity approach, Delta’s annual Free Cash Flow is projected to rise to roughly $5.5 billion by 2029, with additional growth assumed through 2035 based on gradually moderating growth rates. All of these future cash flows are discounted back to the present and summed to arrive at an estimated intrinsic value of about $142.64 per share.
Compared with the current share price, this implies the stock trades at roughly a 50.1% discount to its DCF based fair value. This indicates the market is pricing Delta below the level suggested by its modeled future cash generation.
Result: UNDERVALUED
Our Discounted Cash Flow (DCF) analysis suggests Delta Air Lines is undervalued by 50.1%. Track this in your watchlist or portfolio, or discover 915 more undervalued stocks based on cash flows.
Approach 2: Delta Air Lines Price vs Earnings
For profitable companies like Delta, the price to earnings, or PE, ratio is a practical way to gauge value because it links what investors pay today directly to the profits the business is generating. In general, faster growth and lower perceived risk justify a higher PE, while slower growth, more cyclical earnings, or higher risk tend to warrant a lower multiple.
Delta currently trades on a PE of about 10x, which is slightly above the Airlines industry average of roughly 9.5x, but well below the broader peer group average of around 31.7x. Simply Wall St also calculates a Fair Ratio of 14.3x for Delta, a proprietary estimate of what the company’s PE should be given its earnings growth outlook, profitability, industry, size, and risk profile.
This Fair Ratio is more informative than a simple comparison with peers or the sector, because it adjusts for Delta’s specific growth prospects, margins, balance sheet strength, and market cap, rather than assuming all airlines deserve the same multiple. With the shares at about 10x earnings versus a Fair Ratio of 14.3x, the PE framework points to Delta trading at a meaningful discount to what its fundamentals might justify.
Result: UNDERVALUED

PE ratios tell one story, but what if the real opportunity lies elsewhere? Discover 1460 companies where insiders are betting big on explosive growth.
Upgrade Your Decision Making: Choose your Delta Air Lines Narrative
Earlier we mentioned that there is an even better way to understand valuation, so let us introduce you to Narratives, a simple way to connect your view of Delta’s business to a set of numbers like future revenue, earnings, margins and ultimately a fair value estimate. A Narrative on Simply Wall St is your story about the company, captured as assumptions and forecasts that flow through to a fair value, all hosted in the Community page that millions of investors use. By linking Delta’s strategic choices and risks to a financial forecast, Narratives help you compare that fair value to today’s share price so you can decide whether it looks like a buy, hold, or sell. They also update dynamically when new information like earnings releases, travel demand data, or tariff news arrives, so your view does not go stale. For example, one Delta Narrative on the platform currently implies fair value of about $50 a share, while a more optimistic Narrative points to roughly $74, showing how two investors can look at the same airline and reasonably arrive at very different conclusions.
For Delta Air Lines, however, we'll make it really easy for you with previews of two leading Delta Air Lines Narratives:
Fair value: $73.64 per share
Implied undervaluation vs last close: approximately 3.4%
Assumed annual revenue growth: 3.77%
- Analysts see modest but steady revenue growth driven by premium, loyalty, and international segments, while accepting slightly lower profit margins over time.
- The consensus view assumes Delta can justify a higher future PE multiple than today, reflecting confidence in earnings durability and structural advantages.
- Key risks include softer main cabin demand, tariffs that raise capital costs, and intense competition from low cost carriers that could pressure margins.
Fair value: $59.84 per share
Implied overvaluation vs last close: approximately 18.9%
Assumed annual revenue growth: 3.5%
- The bear case acknowledges Delta’s operational leadership and solid margins but argues that slower revenue growth and a lower justified PE multiple cap upside.
- It highlights a stretched balance sheet and the sensitivity of thin airline margins to external shocks such as trade wars or macro slowdowns.
- Tariff related risks and weakening travel demand, particularly on key transatlantic routes, are seen as potential brakes on both earnings and valuation.
Do you think there's more to the story for Delta Air Lines? Head over to our Community to see what others are saying!
This article by Simply Wall St is general in nature. We provide commentary based on historical data and analyst forecasts only using an unbiased methodology and our articles are not intended to be financial advice. It does not constitute a recommendation to buy or sell any stock, and does not take account of your objectives, or your financial situation. We aim to bring you long-term focused analysis driven by fundamental data. Note that our analysis may not factor in the latest price-sensitive company announcements or qualitative material. Simply Wall St has no position in any stocks mentioned.
Have feedback on this article? Concerned about the content? Get in touch with us directly. Alternatively, email editorial-team@simplywallst.com