
 Nasdaq
 華爾街日報
華爾街日報Is HP Stock Now a Bargain After a 23.5% Slide in 2025?
- Wondering if HP at around $24.83 is a bargain or a value trap? You are not alone. This is exactly the kind of stock where a closer look at valuation can really pay off.
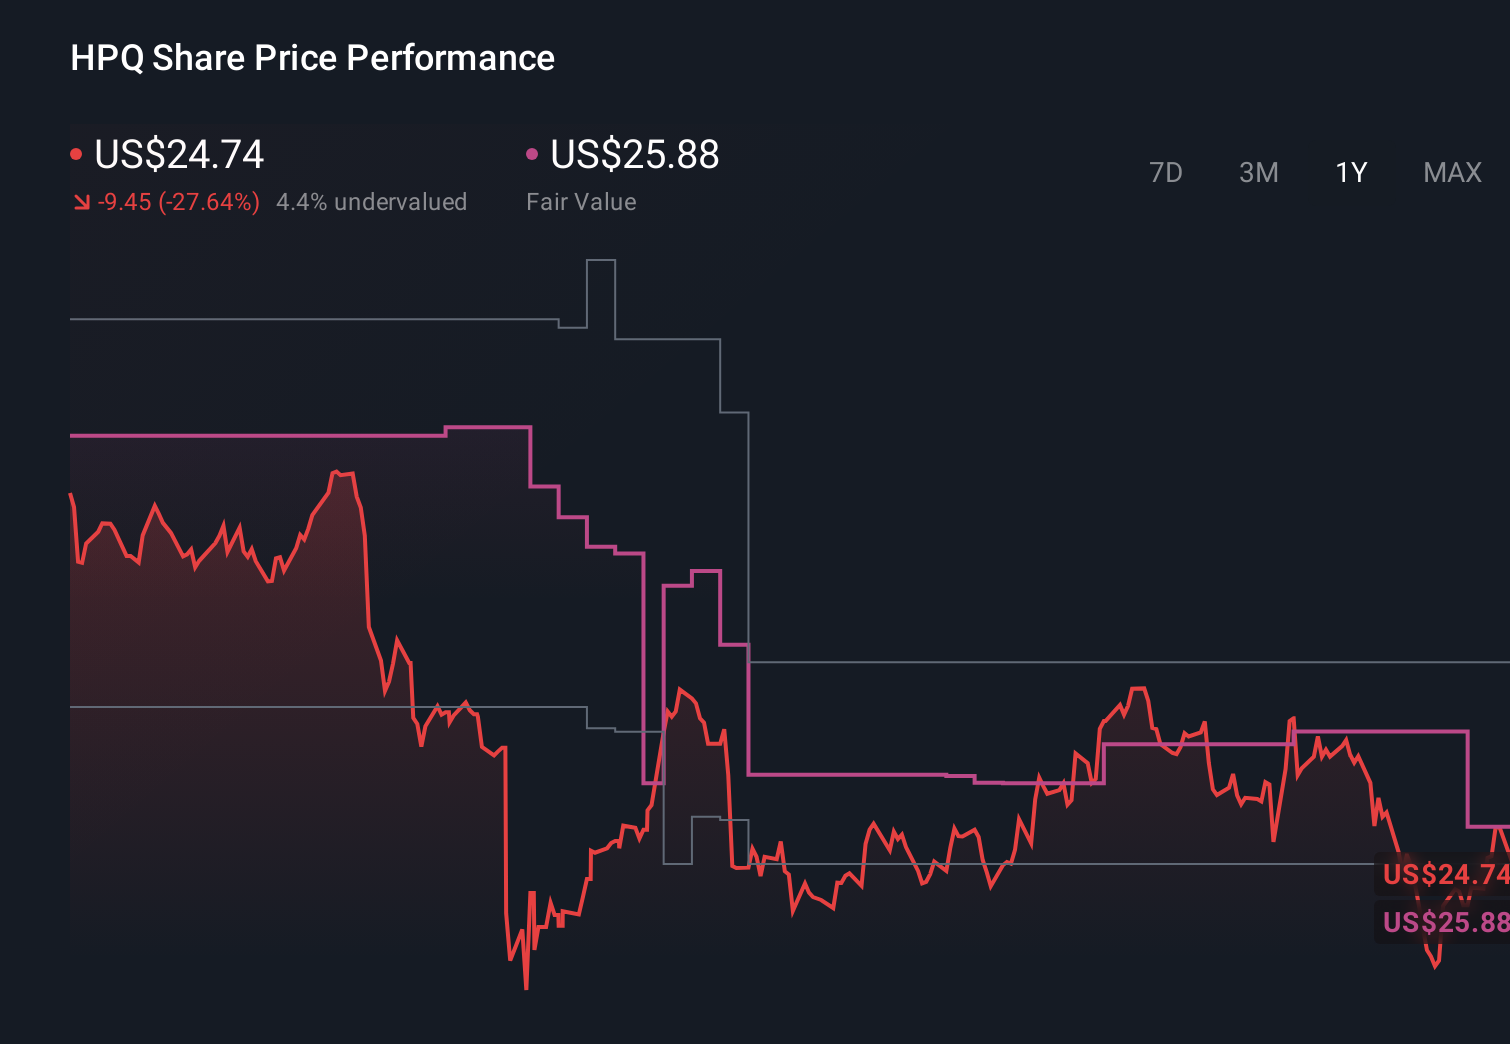
- The share price has slipped about 2.2% over the last week and is roughly flat over the past month at +1.2%. Those short term moves sit against a much steeper year to date slide of about 23.5% that may have reset expectations.
- Recently, the market has been digesting a mix of headlines around the PC and printing demand cycle, shifting enterprise spending priorities, and ongoing concerns about how durable HP's cash flows are in a more cloud centric world. At the same time, HP has continued to emphasize capital returns and operational efficiency, which can change how investors think about the balance between downside risk and long term value.
- On our checks, HP scores a solid 5/6 valuation score, which suggests it screens as undervalued on most traditional metrics. Next, we will walk through what that means using different valuation lenses and finish with a framework that goes one step further than the usual models.
Find out why HP's -23.4% return over the last year is lagging behind its peers.
Approach 1: HP Discounted Cash Flow (DCF) Analysis
A Discounted Cash Flow, or DCF, model estimates what a company is worth by projecting the cash it can generate in the future and then discounting those cash flows back to today in dollar terms.
For HP, the latest twelve months Free Cash Flow sits at about $2.99 billion. Analysts and internal estimates project this to trend modestly higher over time, with forecast Free Cash Flow of roughly $3.47 billion by 2035. The path to that figure runs through the next decade of projections, where near term analyst estimates are blended with longer term extrapolations by Simply Wall St to reflect a maturing but still cash generative business.
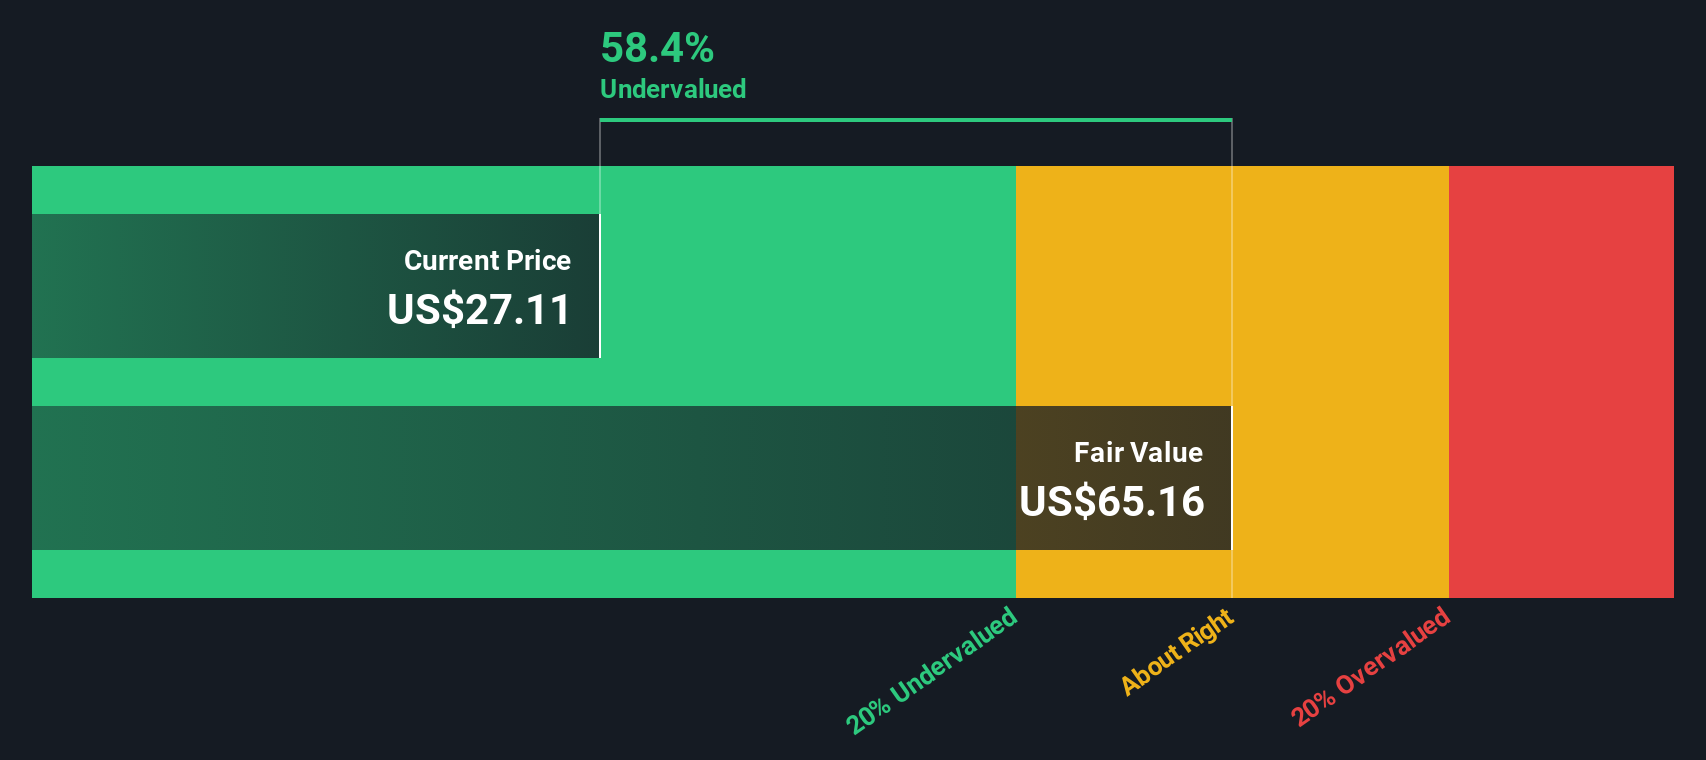
Using a 2 Stage Free Cash Flow to Equity model, these future cash flows imply an intrinsic value of about $46.55 per share. Versus a current price around $24.83, the model suggests HP trades at roughly a 46.7% discount, indicating that the shares may be undervalued if the cash flow profile proves accurate.
Result: UNDERVALUED
Our Discounted Cash Flow (DCF) analysis suggests HP is undervalued by 46.7%. Track this in your watchlist or portfolio, or discover 915 more undervalued stocks based on cash flows.
Approach 2: HP Price vs Earnings
For established, profitable companies like HP, the price to earnings, or PE, ratio is a straightforward way to gauge how much investors are paying for each dollar of current profits. In general, higher expected growth and lower perceived risk justify a higher, or more expensive, PE multiple, while slower growth or higher risk should translate into a lower, cheaper multiple.
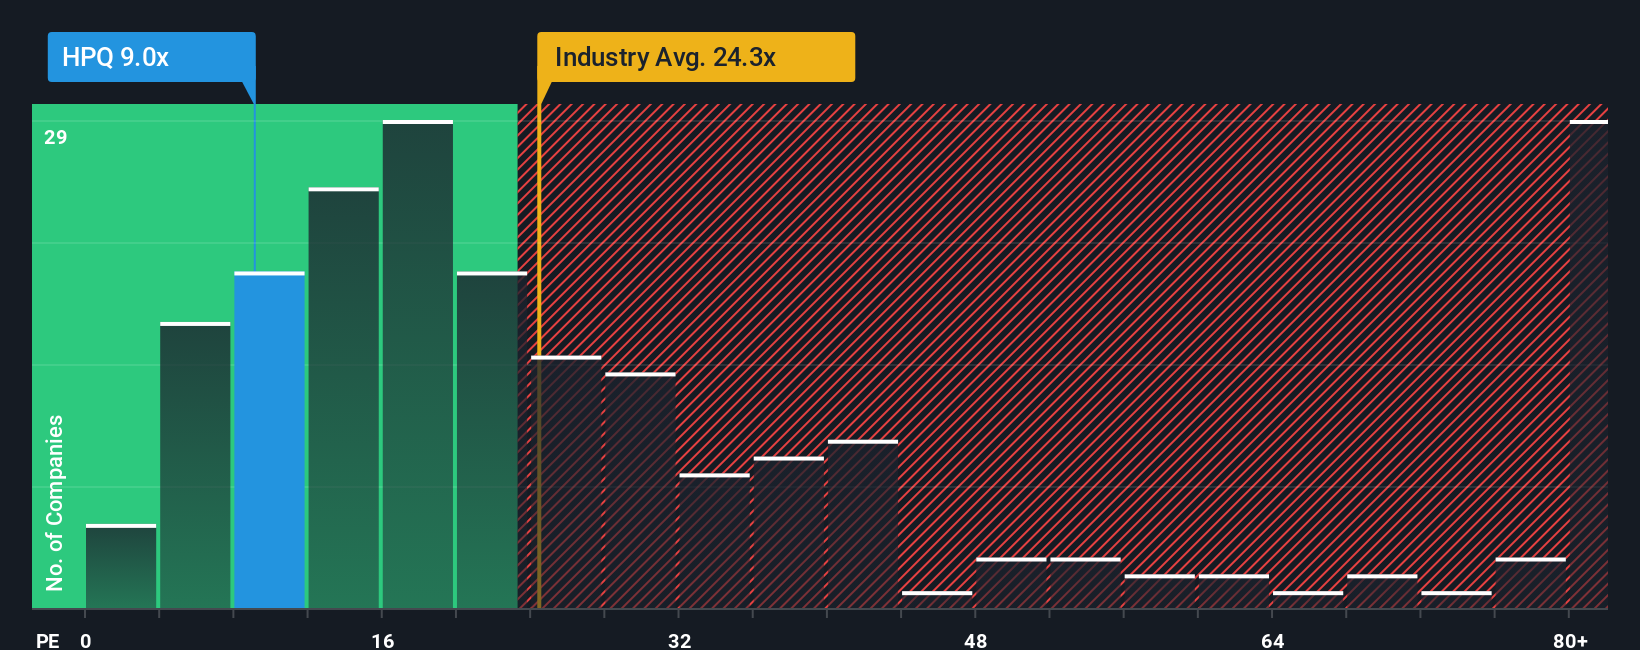
HP currently trades on about 9.0x earnings, which is well below both the broader Tech industry average of roughly 21.9x and a peer group average near 63.8x. On the surface, that large discount suggests the market is skeptical about HP's growth runway and long term durability compared with other tech names.
Simply Wall St estimates a Fair Ratio for HP of about 23.1x. This proprietary metric goes beyond simple peer or industry comparisons by blending in company specific drivers such as earnings growth, profit margins, risk profile, industry positioning, and market cap. Because it is tailored to HP's fundamentals rather than broad sector averages, it can serve as a more nuanced yardstick for what investors may be willing to pay. Set against that Fair Ratio, HP's current 9.0x PE indicates a material valuation gap that appears pessimistic.
Result: UNDERVALUED
PE ratios tell one story, but what if the real opportunity lies elsewhere? Discover 1460 companies where insiders are betting big on explosive growth.
Upgrade Your Decision Making: Choose your HP Narrative
Earlier we mentioned that there is an even better way to understand valuation, so let us introduce you to Narratives, a simple tool on Simply Wall St's Community page that lets you turn your view of HP into a story backed by numbers. It links what you believe about its future products, margins and risks to a concrete forecast for revenue, earnings and cash flows, and then to a Fair Value you can compare with today’s share price to inform a decision on whether to buy, hold or sell. It also updates dynamically as new news or earnings land. For example, a more optimistic HP Narrative might lean into AI PCs, cost savings and services growth to justify a Fair Value closer to the higher analyst target near $30. In contrast, a more cautious Narrative might stress print declines, tougher memory costs and slower PC demand to anchor Fair Value nearer the low end around $25, showing how different yet data driven perspectives can coexist and be tracked over time.
Do you think there's more to the story for HP? Head over to our Community to see what others are saying!
This article by Simply Wall St is general in nature. We provide commentary based on historical data and analyst forecasts only using an unbiased methodology and our articles are not intended to be financial advice. It does not constitute a recommendation to buy or sell any stock, and does not take account of your objectives, or your financial situation. We aim to bring you long-term focused analysis driven by fundamental data. Note that our analysis may not factor in the latest price-sensitive company announcements or qualitative material. Simply Wall St has no position in any stocks mentioned.
Have feedback on this article? Concerned about the content? Get in touch with us directly. Alternatively, email editorial-team@simplywallst.com