
 Nasdaq
 華爾街日報
華爾街日報Okuma (TSE:6103): Assessing Valuation After Recent Share Price Weakness
Okuma (TSE:6103) has quietly held its ground, even after a choppy week for industrial names. That stability is exactly what makes the stock interesting for long term, fundamentals driven investors.
See our latest analysis for Okuma.
After a soft 7 day share price return of minus 6.95 percent, Okuma is still modestly ahead on a year to date share price basis. Its 1 year total shareholder return of 11.34 percent and strong 3 year total shareholder return of 59.90 percent suggest longer term momentum is intact.
If Okuma has you thinking about where else industrial capital is finding a home, it might be worth exploring fast growing stocks with high insider ownership as a way to spot the next wave of conviction backed growth stories.
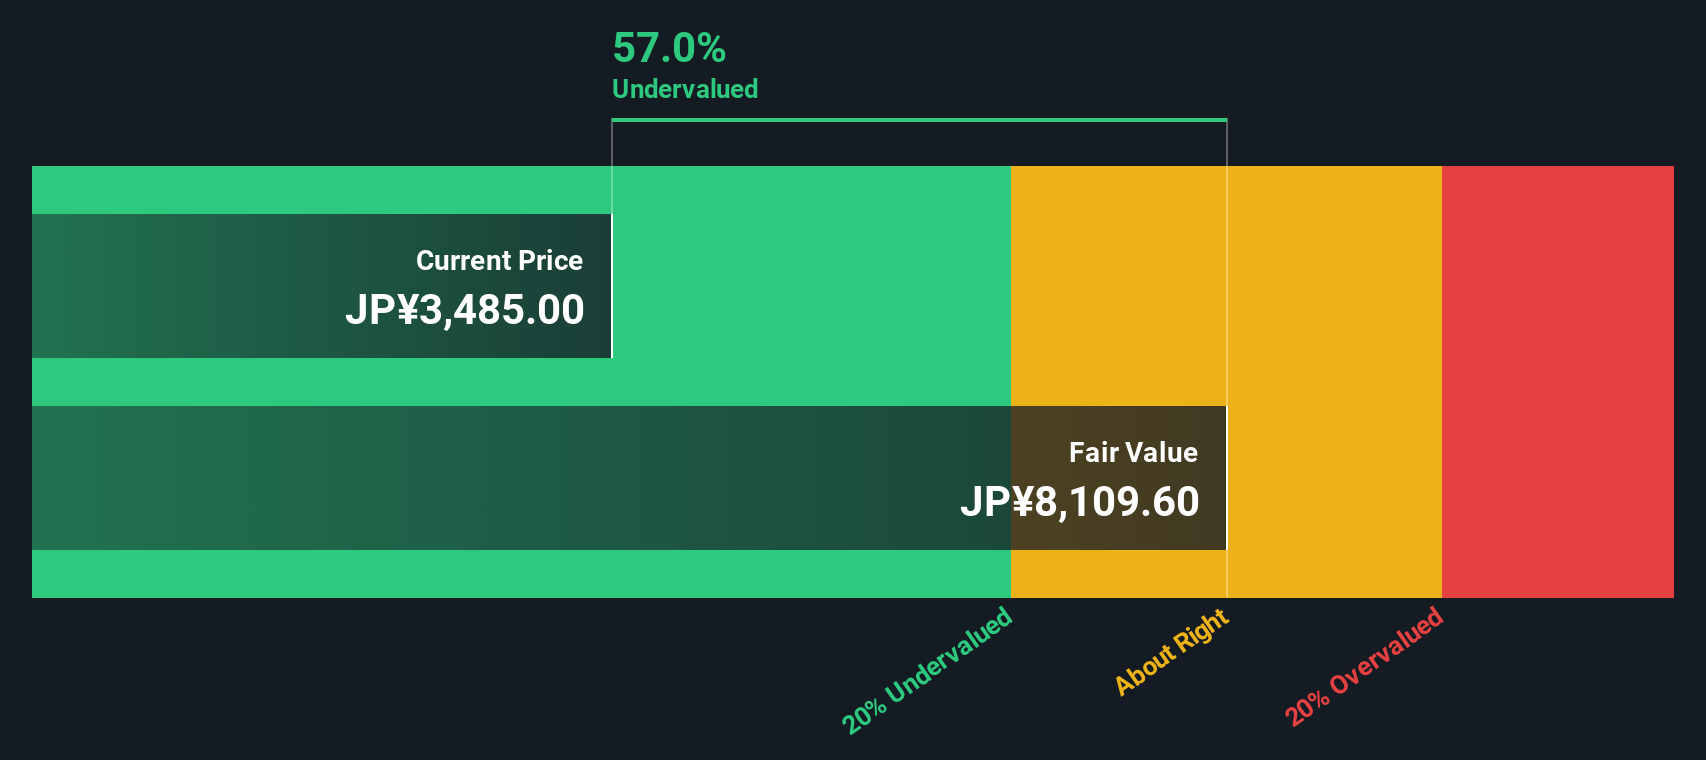
With earnings still growing and the shares trading at a sizable discount to analyst targets and estimated intrinsic value, is Okuma quietly undervalued right now, or is the market already factoring in its next leg of growth?
Price to Earnings of 19.9x: Is It Justified?
Okuma trades on a price to earnings ratio of 19.9 times, even though our DCF based fair value suggests the shares are significantly undervalued at the current ¥3480 price.
The price to earnings multiple compares what investors pay for each unit of current earnings, and it is a key yardstick for machinery and broader industrial stocks where profit cycles and capital intensity matter.
In Okuma's case, the market is assigning a richer multiple despite earnings having fallen over the last year and return on equity remaining low. This implies investors are leaning heavily on forecasts of double digit profit growth ahead rather than current profitability.
That premium looks striking when set against both the industry and a fair value benchmark. Okuma appears more expensive than the average JP Machinery peer and even slightly above our estimated fair price to earnings ratio of 19.6 times, suggesting limited room for further re rating if those growth expectations wobble.
Explore the SWS fair ratio for Okuma
Result: Price to Earnings of 19.9x (OVERVALUED)
However, softer industry demand or a setback to expected double digit profit growth could quickly cool enthusiasm for Okuma’s premium valuation.
Find out about the key risks to this Okuma narrative.
Another View on Value
Our SWS DCF model paints a very different picture, suggesting Okuma’s fair value is around ¥7805 per share. That is roughly 55 percent above today’s ¥3480 price, hinting at a sizeable potential upside. Is the market too cautious about the cycle, or is the model too generous?
Look into how the SWS DCF model arrives at its fair value.
Simply Wall St performs a discounted cash flow (DCF) on every stock in the world every day (check out Okuma for example). We show the entire calculation in full. You can track the result in your watchlist or portfolio and be alerted when this changes, or use our stock screener to discover 915 undervalued stocks based on their cash flows. If you save a screener we even alert you when new companies match - so you never miss a potential opportunity.
Build Your Own Okuma Narrative
If you see the story differently or prefer to dig into the numbers yourself, you can build a personalised view in just a few minutes: Do it your way.
A great starting point for your Okuma research is our analysis highlighting 2 key rewards and 1 important warning sign that could impact your investment decision.
Ready for your next investing move?
Before you log off, lock in an edge by lining up your next opportunities now, so you are not chasing ideas after the market has already moved.
- Capture potential bargains early by scanning these 915 undervalued stocks based on cash flows, where solid cash flow profiles can reveal quality businesses the market has temporarily mispriced.
- Ride powerful structural trends by zeroing in on these 25 AI penny stocks that could benefit as artificial intelligence reshapes productivity and long term profit pools.
- Boost your income strategy by reviewing these 13 dividend stocks with yields > 3% that may offer attractive yields backed by sustainable payout potential and resilient balance sheets.
This article by Simply Wall St is general in nature. We provide commentary based on historical data and analyst forecasts only using an unbiased methodology and our articles are not intended to be financial advice. It does not constitute a recommendation to buy or sell any stock, and does not take account of your objectives, or your financial situation. We aim to bring you long-term focused analysis driven by fundamental data. Note that our analysis may not factor in the latest price-sensitive company announcements or qualitative material. Simply Wall St has no position in any stocks mentioned.
Have feedback on this article? Concerned about the content? Get in touch with us directly. Alternatively, email editorial-team@simplywallst.com