
 Nasdaq
 華爾街日報
華爾街日報OR Royalties (TSX:OR) Valuation Check After an 83% One-Year Surge in the Share Price
OR Royalties (TSX:OR) has quietly climbed about 8% over the past month and is up roughly 83% this year, which puts the stock firmly on investors’ radar as gold prices stay supportive.
See our latest analysis for OR Royalties.
That surge in the 1 year total shareholder return of around 83% alongside a firm 30 day share price return suggests momentum is still building as investors reassess growth prospects and perceived risk around the CA$49.27 share price.
If OR Royalties has sharpened your appetite for long term compounders, this is a good moment to explore fast growing stocks with high insider ownership for more under the radar ideas.
With analyst targets sitting well above today’s price and solid double digit earnings growth, OR Royalties still trades at a noticeable discount. After such a big run, however, investors may wonder whether this is a fresh buying opportunity or if future growth is now fully reflected in the price.
Price to earnings of 45.6x: Is it justified?
On a trailing price to earnings basis of 45.6x at CA$49.27 per share, OR Royalties screens as richly valued versus peers and its own fair ratio.
The price to earnings ratio compares the current share price to the company’s earnings per share and is a common gauge of how much investors are willing to pay for current and future profits in a cash generative, royalty style business.
In this case, the market is paying a premium multiple that implies strong confidence in OR Royalties future earnings trajectory. However, that premium looks stretched when set against the estimated fair price to earnings ratio of 20.6x, a level our work suggests the market could gravitate toward if sentiment cools.
That gap becomes even starker when stacked against the Canadian Metals and Mining industry average of 21.4x and a peer average of 23x. OR Royalties is trading at roughly double those benchmarks, underscoring how aggressively its earnings are currently being capitalised.
Explore the SWS fair ratio for OR Royalties
Result: Price-to-earnings of 45.6x (OVERVALUED)
However, sustained multiple pressure from rising rates or a downturn in gold prices could quickly challenge the market’s optimistic earnings and valuation assumptions.
Find out about the key risks to this OR Royalties narrative.
Another view from our DCF model
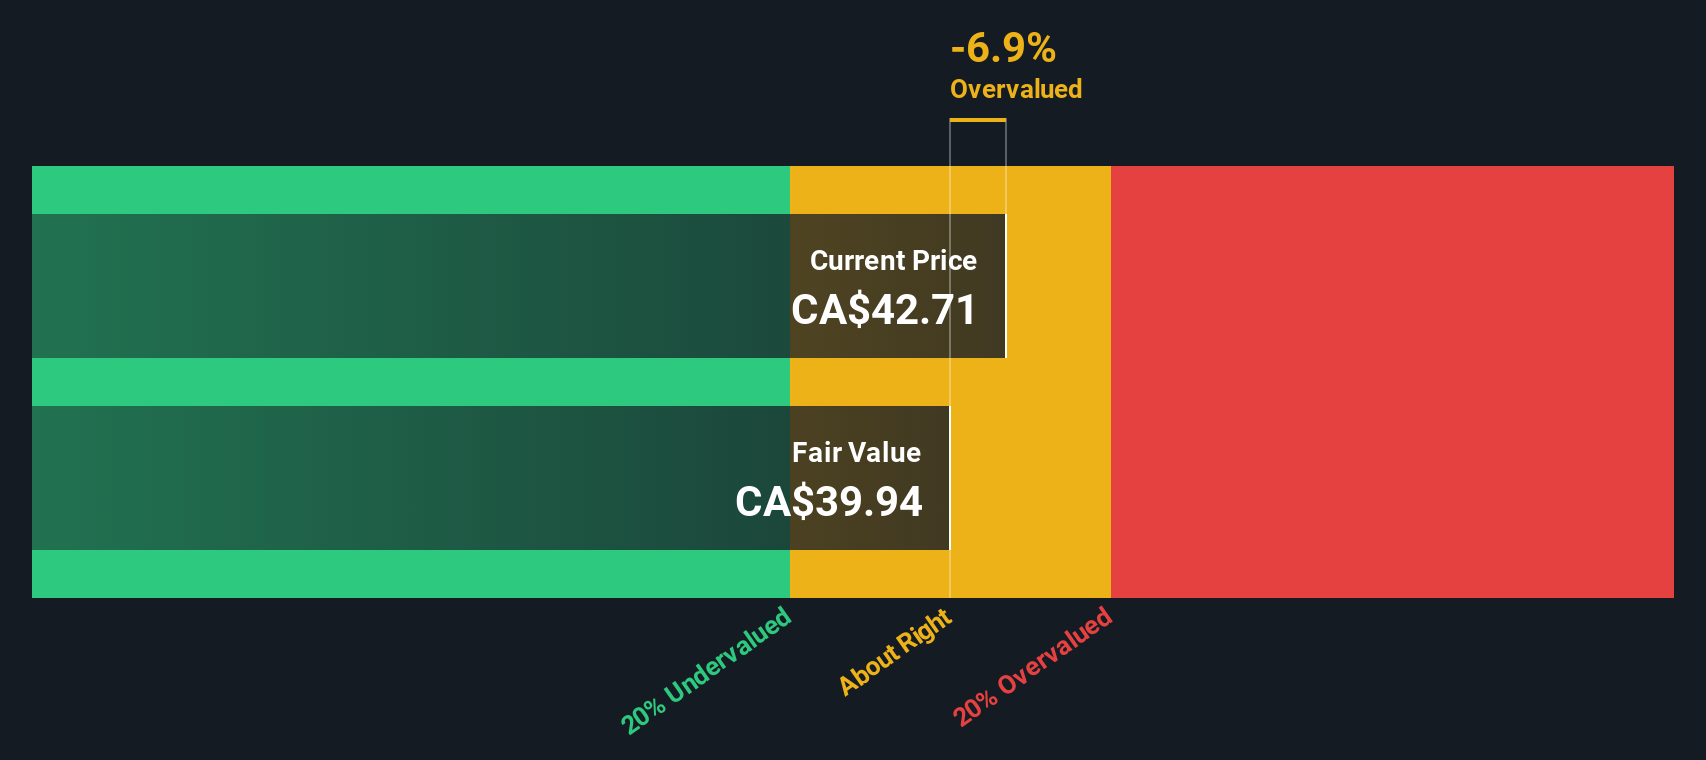
While the price to earnings ratio looks stretched, our DCF model paints a different picture. With OR Royalties trading about 20% below our fair value estimate of roughly CA$61.81, the stock appears undervalued. This raises the question of whether the market is mispricing its long term cash flows.
Look into how the SWS DCF model arrives at its fair value.
Simply Wall St performs a discounted cash flow (DCF) on every stock in the world every day (check out OR Royalties for example). We show the entire calculation in full. You can track the result in your watchlist or portfolio and be alerted when this changes, or use our stock screener to discover 911 undervalued stocks based on their cash flows. If you save a screener we even alert you when new companies match - so you never miss a potential opportunity.
Build Your Own OR Royalties Narrative
If you see the story differently or want to dig into the numbers yourself, you can build a complete view in just minutes: Do it your way.
A great starting point for your OR Royalties research is our analysis highlighting 4 key rewards and 1 important warning sign that could impact your investment decision.
Ready for your next investing move?
OR Royalties might be compelling, but you may miss out if you ignore other opportunities our screener surfaces across different themes and strategies.
- Capitalize on mispriced quality by targeting these 911 undervalued stocks based on cash flows that pair strong fundamentals with attractive entry points before the crowd catches on.
- Ride structural healthcare trends by zeroing in on these 30 healthcare AI stocks transforming diagnostics, treatment, and patient outcomes with intelligent tools.
- Position for the next digital wave by focusing on these 80 cryptocurrency and blockchain stocks shaping infrastructure, payments, and blockchain enabled services worldwide.
This article by Simply Wall St is general in nature. We provide commentary based on historical data and analyst forecasts only using an unbiased methodology and our articles are not intended to be financial advice. It does not constitute a recommendation to buy or sell any stock, and does not take account of your objectives, or your financial situation. We aim to bring you long-term focused analysis driven by fundamental data. Note that our analysis may not factor in the latest price-sensitive company announcements or qualitative material. Simply Wall St has no position in any stocks mentioned.
Have feedback on this article? Concerned about the content? Get in touch with us directly. Alternatively, email editorial-team@simplywallst.com