
 Nasdaq
 華爾街日報
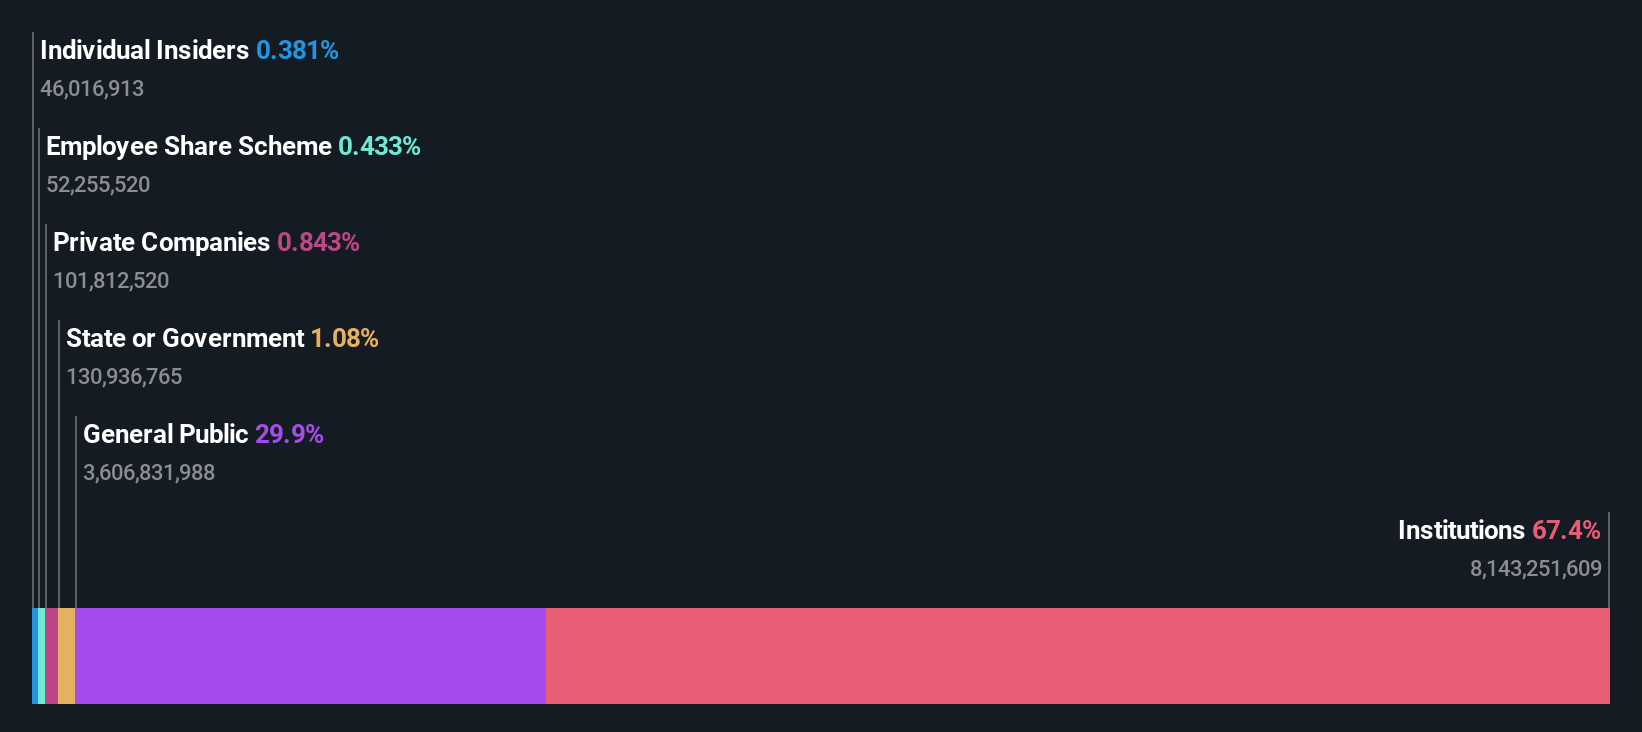
華爾街日報With 67% ownership of the shares, Malayan Banking Berhad (KLSE:MAYBANK) is heavily dominated by institutional owners
Key Insights
- Significantly high institutional ownership implies Malayan Banking Berhad's stock price is sensitive to their trading actions
- 52% of the business is held by the top 2 shareholders
- Ownership research along with analyst forecasts data help provide a good understanding of opportunities in a stock
A look at the shareholders of Malayan Banking Berhad (KLSE:MAYBANK) can tell us which group is most powerful. The group holding the most number of shares in the company, around 67% to be precise, is institutions. Put another way, the group faces the maximum upside potential (or downside risk).
Given the vast amount of money and research capacities at their disposal, institutional ownership tends to carry a lot of weight, especially with individual investors. Hence, having a considerable amount of institutional money invested in a company is often regarded as a desirable trait.
In the chart below, we zoom in on the different ownership groups of Malayan Banking Berhad.
See our latest analysis for Malayan Banking Berhad
What Does The Institutional Ownership Tell Us About Malayan Banking Berhad?
Institutional investors commonly compare their own returns to the returns of a commonly followed index. So they generally do consider buying larger companies that are included in the relevant benchmark index.
As you can see, institutional investors have a fair amount of stake in Malayan Banking Berhad. This implies the analysts working for those institutions have looked at the stock and they like it. But just like anyone else, they could be wrong. It is not uncommon to see a big share price drop if two large institutional investors try to sell out of a stock at the same time. So it is worth checking the past earnings trajectory of Malayan Banking Berhad, (below). Of course, keep in mind that there are other factors to consider, too.

Institutional investors own over 50% of the company, so together than can probably strongly influence board decisions. Malayan Banking Berhad is not owned by hedge funds. Our data shows that Permodalan Nasional Berhad is the largest shareholder with 40% of shares outstanding. With 11% and 5.4% of the shares outstanding respectively, Employees Provident Fund of Malaysia and Kumpulan Wang Persaraan are the second and third largest shareholders.
A more detailed study of the shareholder registry showed us that 2 of the top shareholders have a considerable amount of ownership in the company, via their 52% stake.
While studying institutional ownership for a company can add value to your research, it is also a good practice to research analyst recommendations to get a deeper understand of a stock's expected performance. Quite a few analysts cover the stock, so you could look into forecast growth quite easily.
Insider Ownership Of Malayan Banking Berhad
The definition of company insiders can be subjective and does vary between jurisdictions. Our data reflects individual insiders, capturing board members at the very least. Management ultimately answers to the board. However, it is not uncommon for managers to be executive board members, especially if they are a founder or the CEO.
Insider ownership is positive when it signals leadership are thinking like the true owners of the company. However, high insider ownership can also give immense power to a small group within the company. This can be negative in some circumstances.
Our most recent data indicates that insiders own less than 1% of Malayan Banking Berhad. As it is a large company, we'd only expect insiders to own a small percentage of it. But it's worth noting that they own RM477m worth of shares. It is always good to see at least some insider ownership, but it might be worth checking if those insiders have been selling.
General Public Ownership
With a 30% ownership, the general public, mostly comprising of individual investors, have some degree of sway over Malayan Banking Berhad. While this size of ownership may not be enough to sway a policy decision in their favour, they can still make a collective impact on company policies.
Next Steps:
While it is well worth considering the different groups that own a company, there are other factors that are even more important. Consider for instance, the ever-present spectre of investment risk. We've identified 1 warning sign with Malayan Banking Berhad , and understanding them should be part of your investment process.
If you would prefer discover what analysts are predicting in terms of future growth, do not miss this free report on analyst forecasts.
NB: Figures in this article are calculated using data from the last twelve months, which refer to the 12-month period ending on the last date of the month the financial statement is dated. This may not be consistent with full year annual report figures.
Have feedback on this article? Concerned about the content? Get in touch with us directly. Alternatively, email editorial-team (at) simplywallst.com.
This article by Simply Wall St is general in nature. We provide commentary based on historical data and analyst forecasts only using an unbiased methodology and our articles are not intended to be financial advice. It does not constitute a recommendation to buy or sell any stock, and does not take account of your objectives, or your financial situation. We aim to bring you long-term focused analysis driven by fundamental data. Note that our analysis may not factor in the latest price-sensitive company announcements or qualitative material. Simply Wall St has no position in any stocks mentioned.