
 Nasdaq
 華爾街日報
華爾街日報Invisio AB (publ)'s (STO:IVSO) recent 4.1% pullback adds to one-year year losses, institutional owners may take drastic measures
Key Insights
- Institutions' substantial holdings in Invisio implies that they have significant influence over the company's share price
- The top 6 shareholders own 54% of the company
- Insiders have bought recently
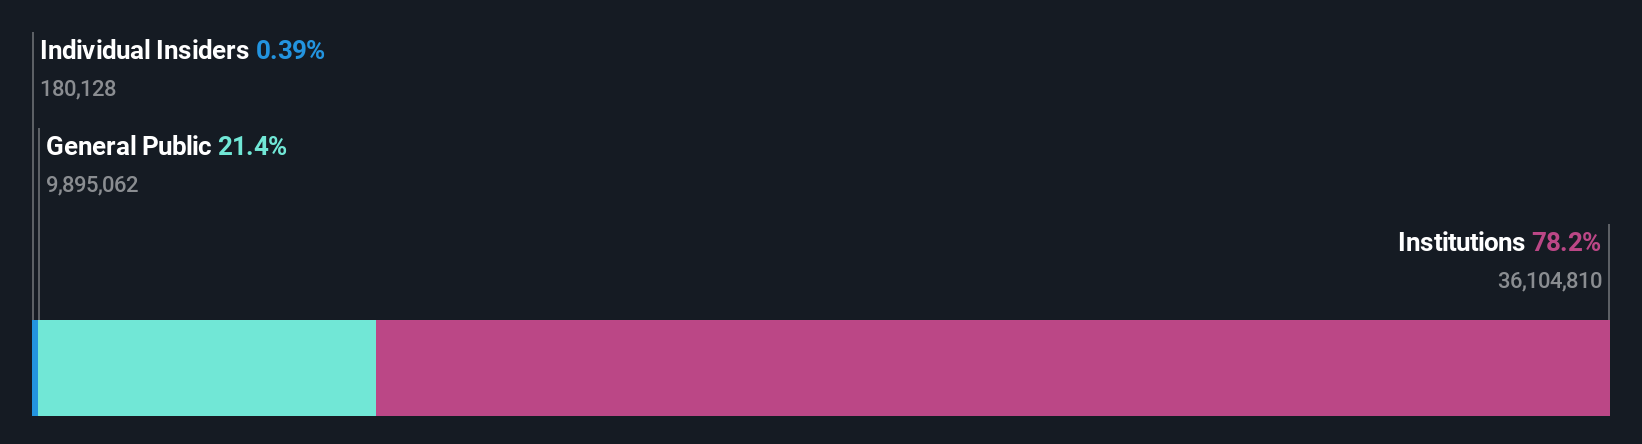
A look at the shareholders of Invisio AB (publ) (STO:IVSO) can tell us which group is most powerful. And the group that holds the biggest piece of the pie are institutions with 78% ownership. In other words, the group stands to gain the most (or lose the most) from their investment into the company.
As a result, institutional investors endured the highest losses last week after market cap fell by kr508m. Needless to say, the recent loss which further adds to the one-year loss to shareholders of 2.6% might not go down well especially with this category of shareholders. Often called “market movers", institutions wield significant power in influencing the price dynamics of any stock. Hence, if weakness in Invisio's share price continues, institutional investors may feel compelled to sell the stock, which might not be ideal for individual investors.
Let's delve deeper into each type of owner of Invisio, beginning with the chart below.
View our latest analysis for Invisio
What Does The Institutional Ownership Tell Us About Invisio?
Institutions typically measure themselves against a benchmark when reporting to their own investors, so they often become more enthusiastic about a stock once it's included in a major index. We would expect most companies to have some institutions on the register, especially if they are growing.
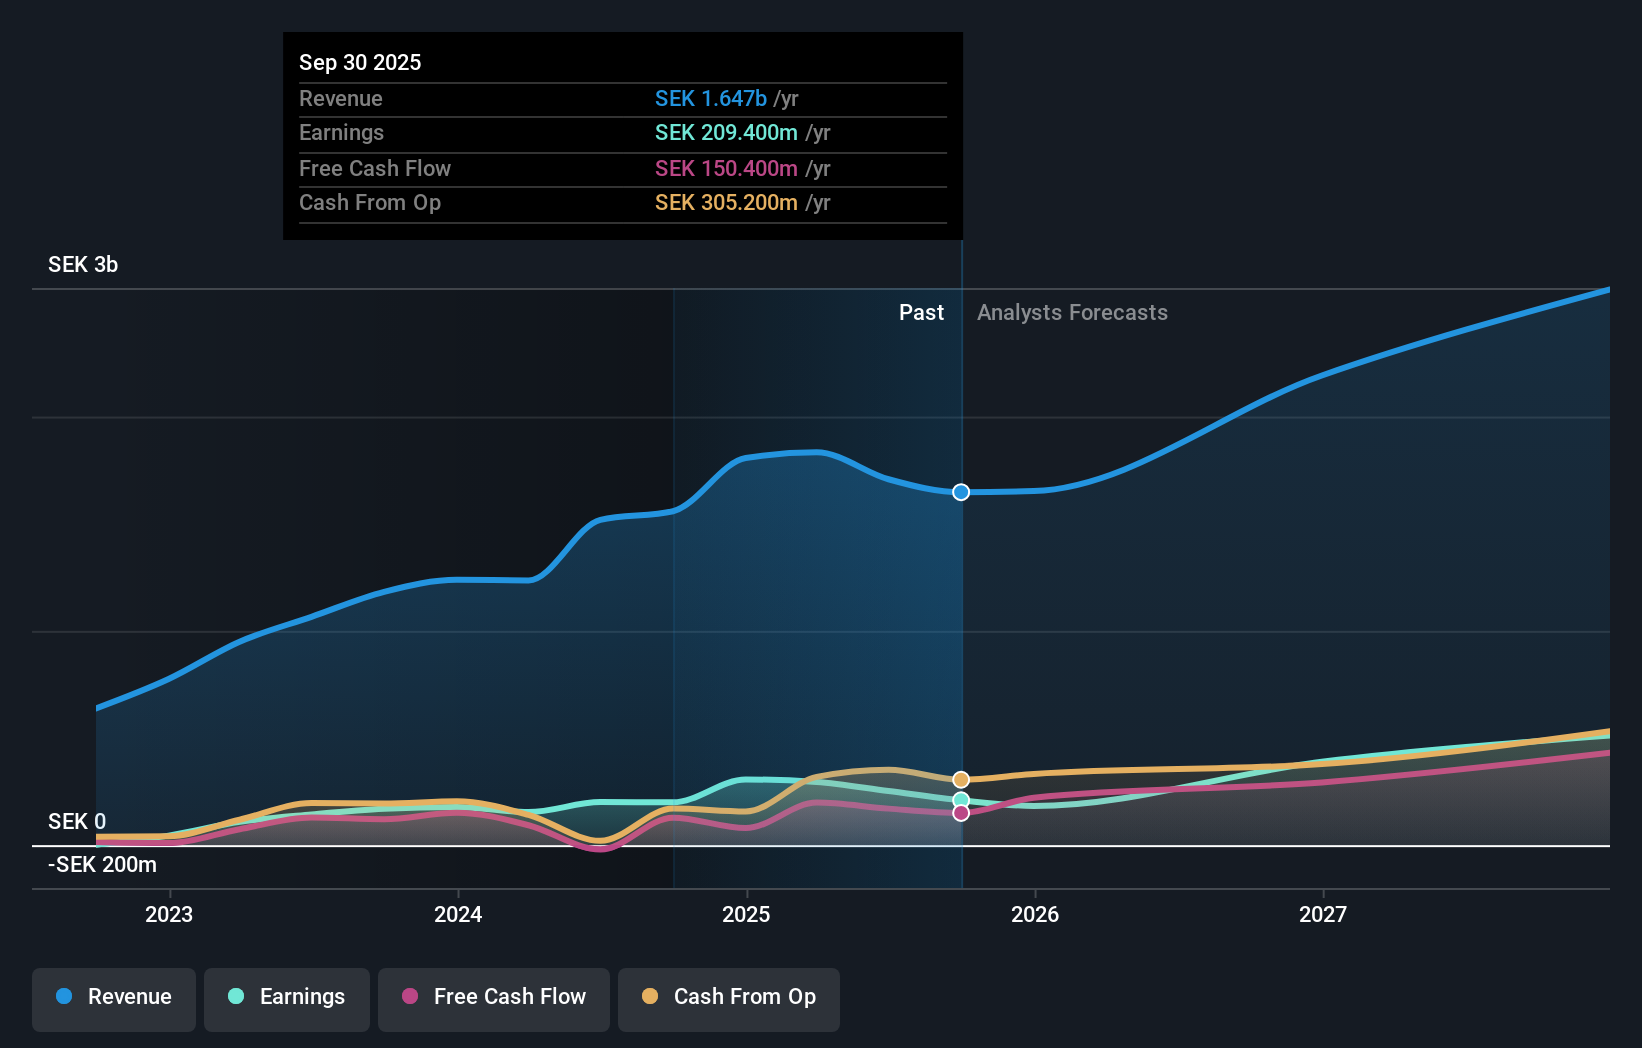
As you can see, institutional investors have a fair amount of stake in Invisio. This implies the analysts working for those institutions have looked at the stock and they like it. But just like anyone else, they could be wrong. If multiple institutions change their view on a stock at the same time, you could see the share price drop fast. It's therefore worth looking at Invisio's earnings history below. Of course, the future is what really matters.
Investors should note that institutions actually own more than half the company, so they can collectively wield significant power. Invisio is not owned by hedge funds. William Demant Invest A/S is currently the company's largest shareholder with 20% of shares outstanding. The second and third largest shareholders are Swedbank Robur Fonder AB and SEB Investment Management AB, with an equal amount of shares to their name at 9.4%.
On further inspection, we found that more than half the company's shares are owned by the top 6 shareholders, suggesting that the interests of the larger shareholders are balanced out to an extent by the smaller ones.
Researching institutional ownership is a good way to gauge and filter a stock's expected performance. The same can be achieved by studying analyst sentiments. There are plenty of analysts covering the stock, so it might be worth seeing what they are forecasting, too.
Insider Ownership Of Invisio
While the precise definition of an insider can be subjective, almost everyone considers board members to be insiders. Company management run the business, but the CEO will answer to the board, even if he or she is a member of it.
I generally consider insider ownership to be a good thing. However, on some occasions it makes it more difficult for other shareholders to hold the board accountable for decisions.
Our most recent data indicates that insiders own less than 1% of Invisio AB (publ). It's a big company, so even a small proportional interest can create alignment between the board and shareholders. In this case insiders own kr47m worth of shares. Arguably, recent buying and selling is just as important to consider. You can click here to see if insiders have been buying or selling.
General Public Ownership
With a 21% ownership, the general public, mostly comprising of individual investors, have some degree of sway over Invisio. While this group can't necessarily call the shots, it can certainly have a real influence on how the company is run.
Next Steps:
I find it very interesting to look at who exactly owns a company. But to truly gain insight, we need to consider other information, too.
Many find it useful to take an in depth look at how a company has performed in the past. You can access this detailed graph of past earnings, revenue and cash flow.
If you would prefer discover what analysts are predicting in terms of future growth, do not miss this free report on analyst forecasts.
NB: Figures in this article are calculated using data from the last twelve months, which refer to the 12-month period ending on the last date of the month the financial statement is dated. This may not be consistent with full year annual report figures.
Have feedback on this article? Concerned about the content? Get in touch with us directly. Alternatively, email editorial-team (at) simplywallst.com.
This article by Simply Wall St is general in nature. We provide commentary based on historical data and analyst forecasts only using an unbiased methodology and our articles are not intended to be financial advice. It does not constitute a recommendation to buy or sell any stock, and does not take account of your objectives, or your financial situation. We aim to bring you long-term focused analysis driven by fundamental data. Note that our analysis may not factor in the latest price-sensitive company announcements or qualitative material. Simply Wall St has no position in any stocks mentioned.