
 Nasdaq
 華爾街日報
華爾街日報Is Regeneron Still Attractively Priced After Its Recent Share Price Surge?
- If you are wondering whether Regeneron Pharmaceuticals is still worth considering after its big run, or if most of the upside is already reflected in the price, this breakdown outlines where the potential value may be found.
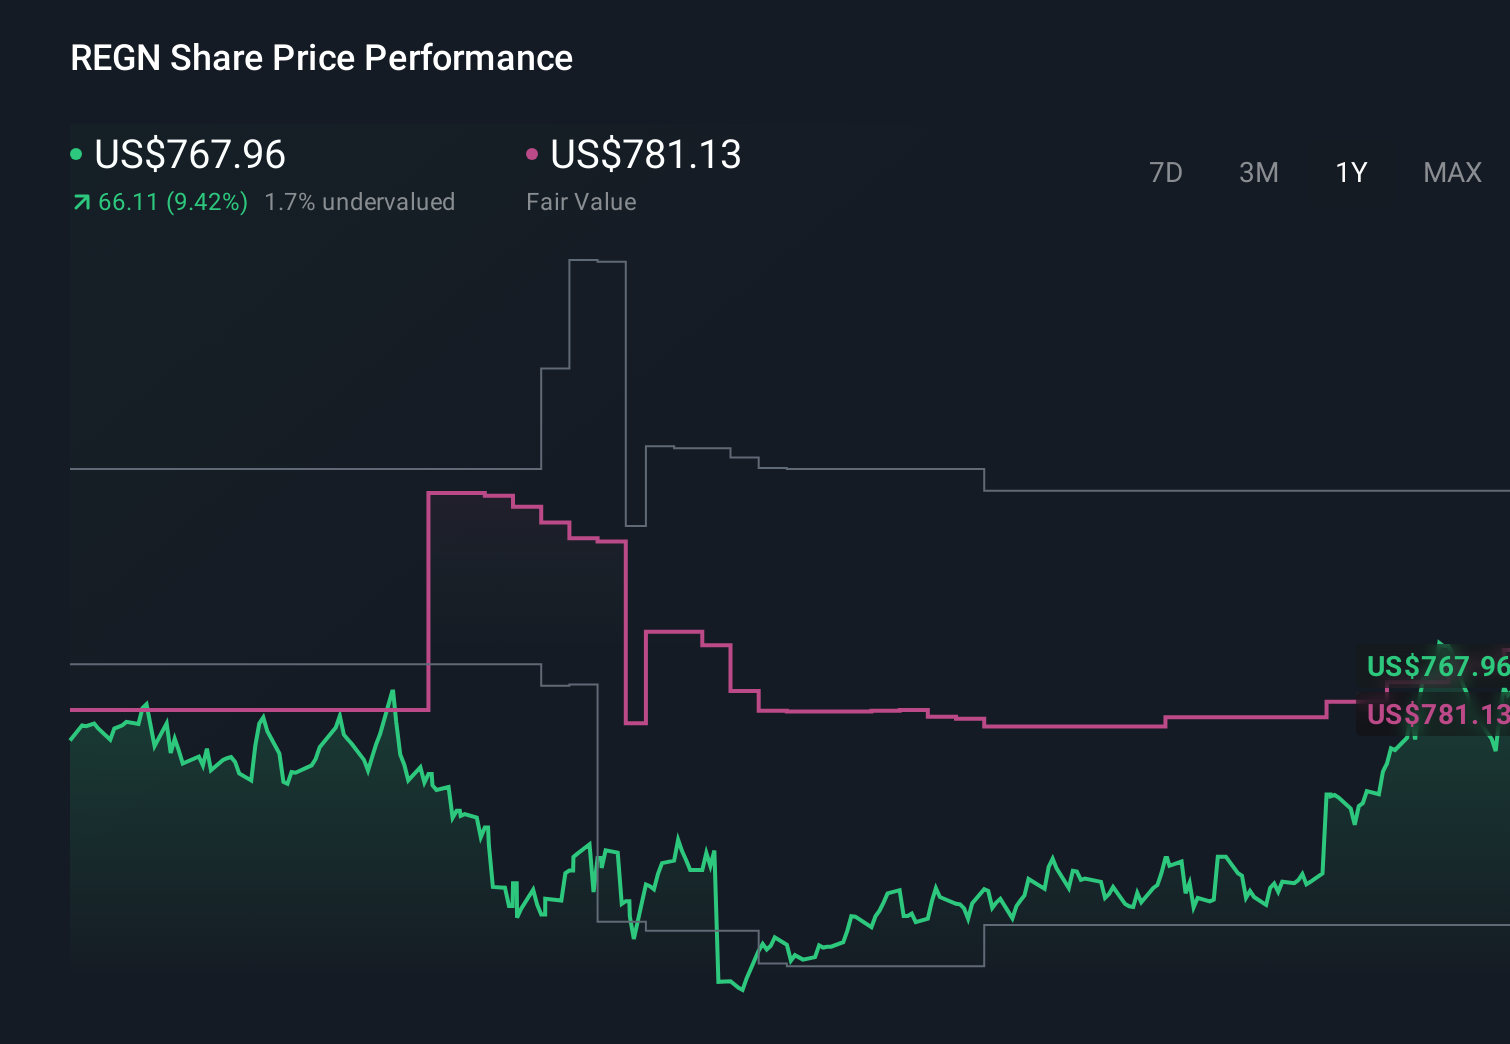
- The stock has climbed 7.8% over the last week and 7.6% over the last month, reaching about $746.36, while longer-term returns sit at 4.4% year to date and 53.1% over five years.
- Recent attention has focused on Regeneron's expanding pipeline and its position in high-value therapeutic areas, which has supported the share price and reinforced its reputation as a long-term growth story. At the same time, renewed interest in innovative biotech names has put companies like Regeneron back on the radar for investors who had previously stayed on the sidelines.
- On our framework, Regeneron scores a 5/6 valuation check score, suggesting it appears undervalued on most of the key metrics. Below, we walk through those approaches in detail before exploring an additional way to think about what the stock may be worth.
Find out why Regeneron Pharmaceuticals's 1.4% return over the last year is lagging behind its peers.
Approach 1: Regeneron Pharmaceuticals Discounted Cash Flow (DCF) Analysis
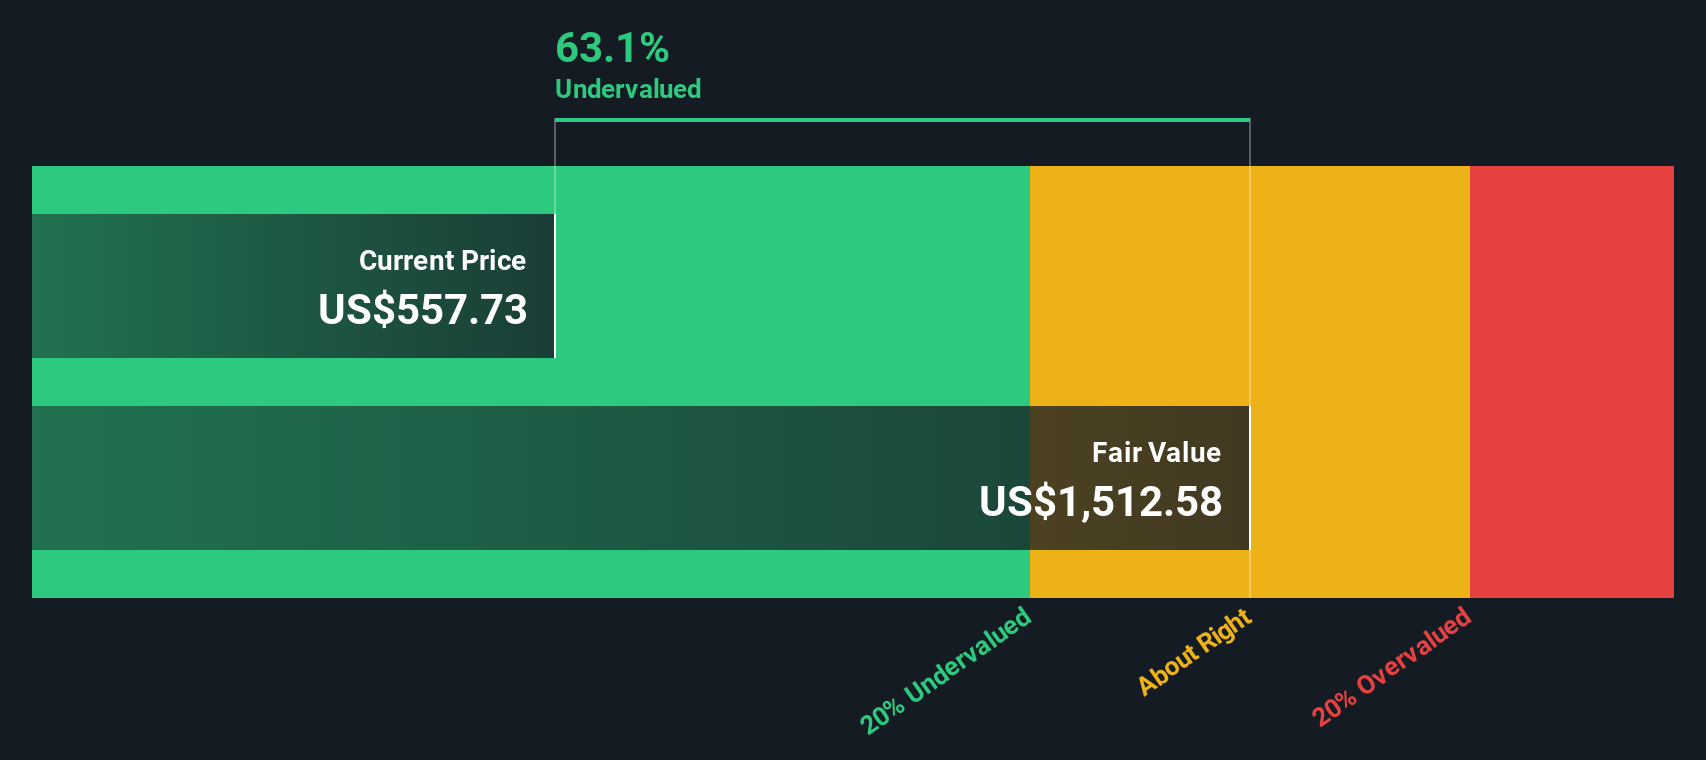
A Discounted Cash Flow model estimates what a company is worth today by projecting its future cash flows and discounting them back to the present. For Regeneron Pharmaceuticals, the 2 Stage Free Cash Flow to Equity model starts with the latest twelve month free cash flow of about $4.0 billion and then applies analyst forecasts for the next few years, followed by more conservative long term growth assumptions.
Analysts see free cash flow rising to around $6.4 billion by 2029, with further gradual growth extrapolated beyond that by Simply Wall St. These projected cash flows, when discounted back to today in dollars, produce an estimated intrinsic value of about $1,592.76 per share.
Compared with the recent market price of roughly $746, this implies the shares trade at about a 53.1% discount to their DCF derived fair value. This suggests investors are paying considerably less than what the projected cash flows would justify.
Result: UNDERVALUED
Our Discounted Cash Flow (DCF) analysis suggests Regeneron Pharmaceuticals is undervalued by 53.1%. Track this in your watchlist or portfolio, or discover 909 more undervalued stocks based on cash flows.
Approach 2: Regeneron Pharmaceuticals Price vs Earnings
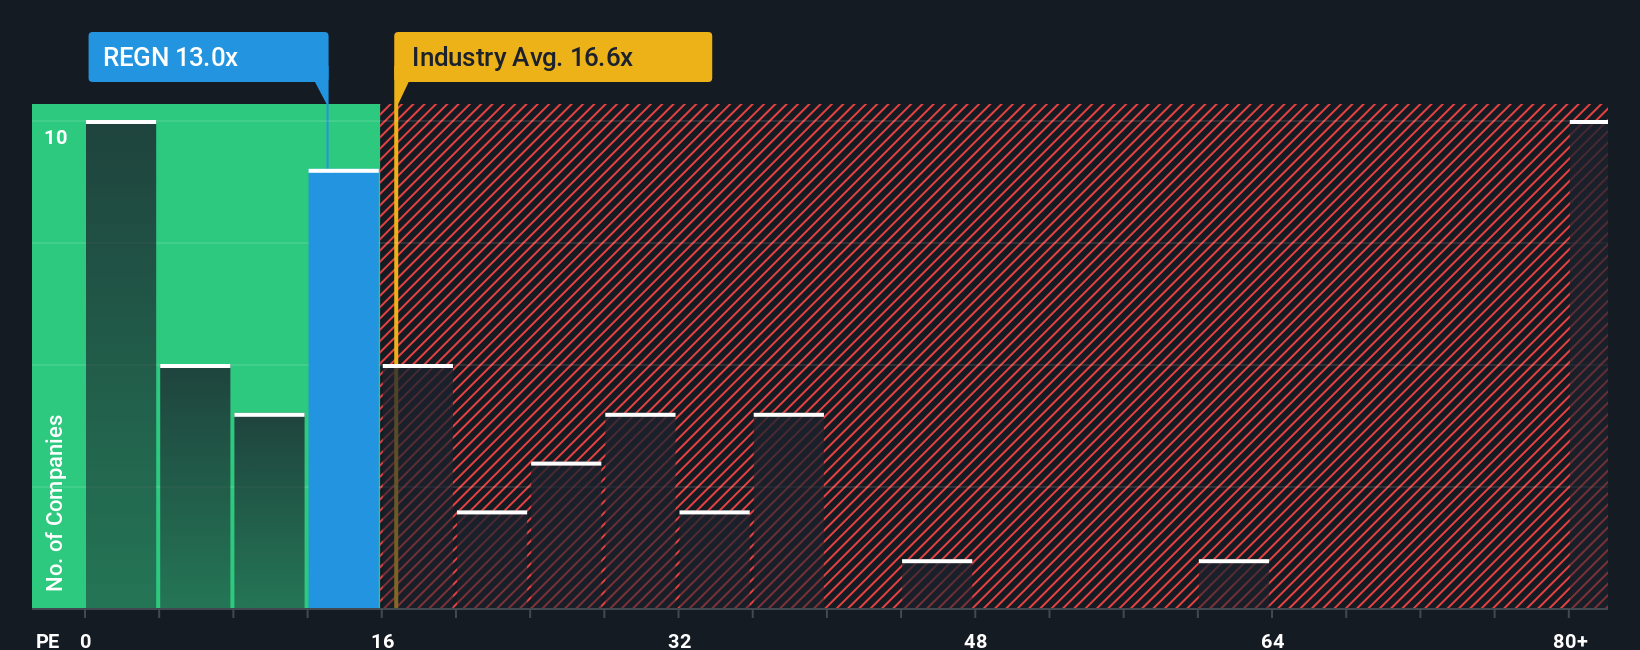
For a profitable, established biotech like Regeneron Pharmaceuticals, the price to earnings ratio is a useful way to judge valuation because it directly relates what investors are paying to the company’s actual earnings power. In general, stronger and more durable earnings growth can justify a higher PE ratio. Higher risk or slower growth should lead to a lower, more conservative multiple.
Regeneron currently trades on a PE of about 16.73x, which is below both the broader Biotechs industry average of roughly 18.78x and the peer group average of around 22.58x. Simply Wall St also calculates a proprietary Fair Ratio for each company. For Regeneron this comes out at approximately 27.53x. This Fair Ratio reflects what a more appropriate PE might be after factoring in its earnings growth outlook, profitability, industry, market cap and specific risk profile.
Because the Fair Ratio explicitly incorporates these fundamentals, it provides a more tailored benchmark than a simple comparison with peers or the sector average. On this basis, Regeneron’s current PE sits well below its Fair Ratio, indicating the shares appear undervalued when judged against their company specific profile.
Result: UNDERVALUED
PE ratios tell one story, but what if the real opportunity lies elsewhere? Discover 1457 companies where insiders are betting big on explosive growth.
Upgrade Your Decision Making: Choose your Regeneron Pharmaceuticals Narrative
Earlier we mentioned that there is an even better way to understand valuation, so let us introduce you to Narratives, a simple way to connect your view of Regeneron Pharmaceuticals with the numbers behind its fair value and future revenue, earnings and margins.
A Narrative is essentially your story about the company, captured in a few key assumptions about how its business will grow, how profitable it can be, and what multiple it deserves. These assumptions then translate directly into a financial forecast and a fair value estimate.
On Simply Wall St, Narratives sit inside the Community page and are used by millions of investors as an easy, visual tool to compare their Fair Value to the current share price. This can help them decide whether Regeneron looks like a buy, a hold, or a sell today.
Because Narratives are updated dynamically as new news, earnings results or guidance arrive, your view can evolve in real time. For example, a more optimistic investor might build a Narrative that points to a fair value near $890, while a more cautious investor might anchor closer to $543 based on the same incoming information.
Do you think there's more to the story for Regeneron Pharmaceuticals? Head over to our Community to see what others are saying!
This article by Simply Wall St is general in nature. We provide commentary based on historical data and analyst forecasts only using an unbiased methodology and our articles are not intended to be financial advice. It does not constitute a recommendation to buy or sell any stock, and does not take account of your objectives, or your financial situation. We aim to bring you long-term focused analysis driven by fundamental data. Note that our analysis may not factor in the latest price-sensitive company announcements or qualitative material. Simply Wall St has no position in any stocks mentioned.
Have feedback on this article? Concerned about the content? Get in touch with us directly. Alternatively, email editorial-team@simplywallst.com