
 Nasdaq
 華爾街日報
華爾街日報B. Riley Financial (RILY) Q2 Profit From Discontinued Ops Tests Long-Running Bearish Narrative
B. Riley Financial (RILY) has swung back to positive quarterly earnings in Q2 2025, posting revenue of about $199 million and EPS of roughly $2.23, even as trailing 12 month figures still reflect sizable losses. The company has seen revenue move from about $38 million in Q2 2024 to nearly $199 million in Q2 2025, while quarterly EPS has shifted from roughly negative $14.86 to positive $2.23. This sets up a sharp contrast between the latest quarter and its loss making recent history and puts the spotlight firmly on how durable these margin gains might be.
See our full analysis for B. Riley Financial.With the headline numbers on the table, the next step is to compare this earnings print with the dominant market narratives around B. Riley to see which stories still hold up and which ones the latest margins start to challenge.
Curious how numbers become stories that shape markets? Explore Community Narratives
Q2 profit driven by discontinued operations
- Net income excluding extra items moved from a loss of about $15.4 million in Q1 2025 to a profit of roughly $68.1 million in Q2 2025, alongside earnings from discontinued operations rising from about $3.4 million to $69.3 million over the same period.
- Bears highlight RILY’s history of steep losses, and this sharp swing to profit leans heavily on discontinued operations rather than a long string of profitable quarters.
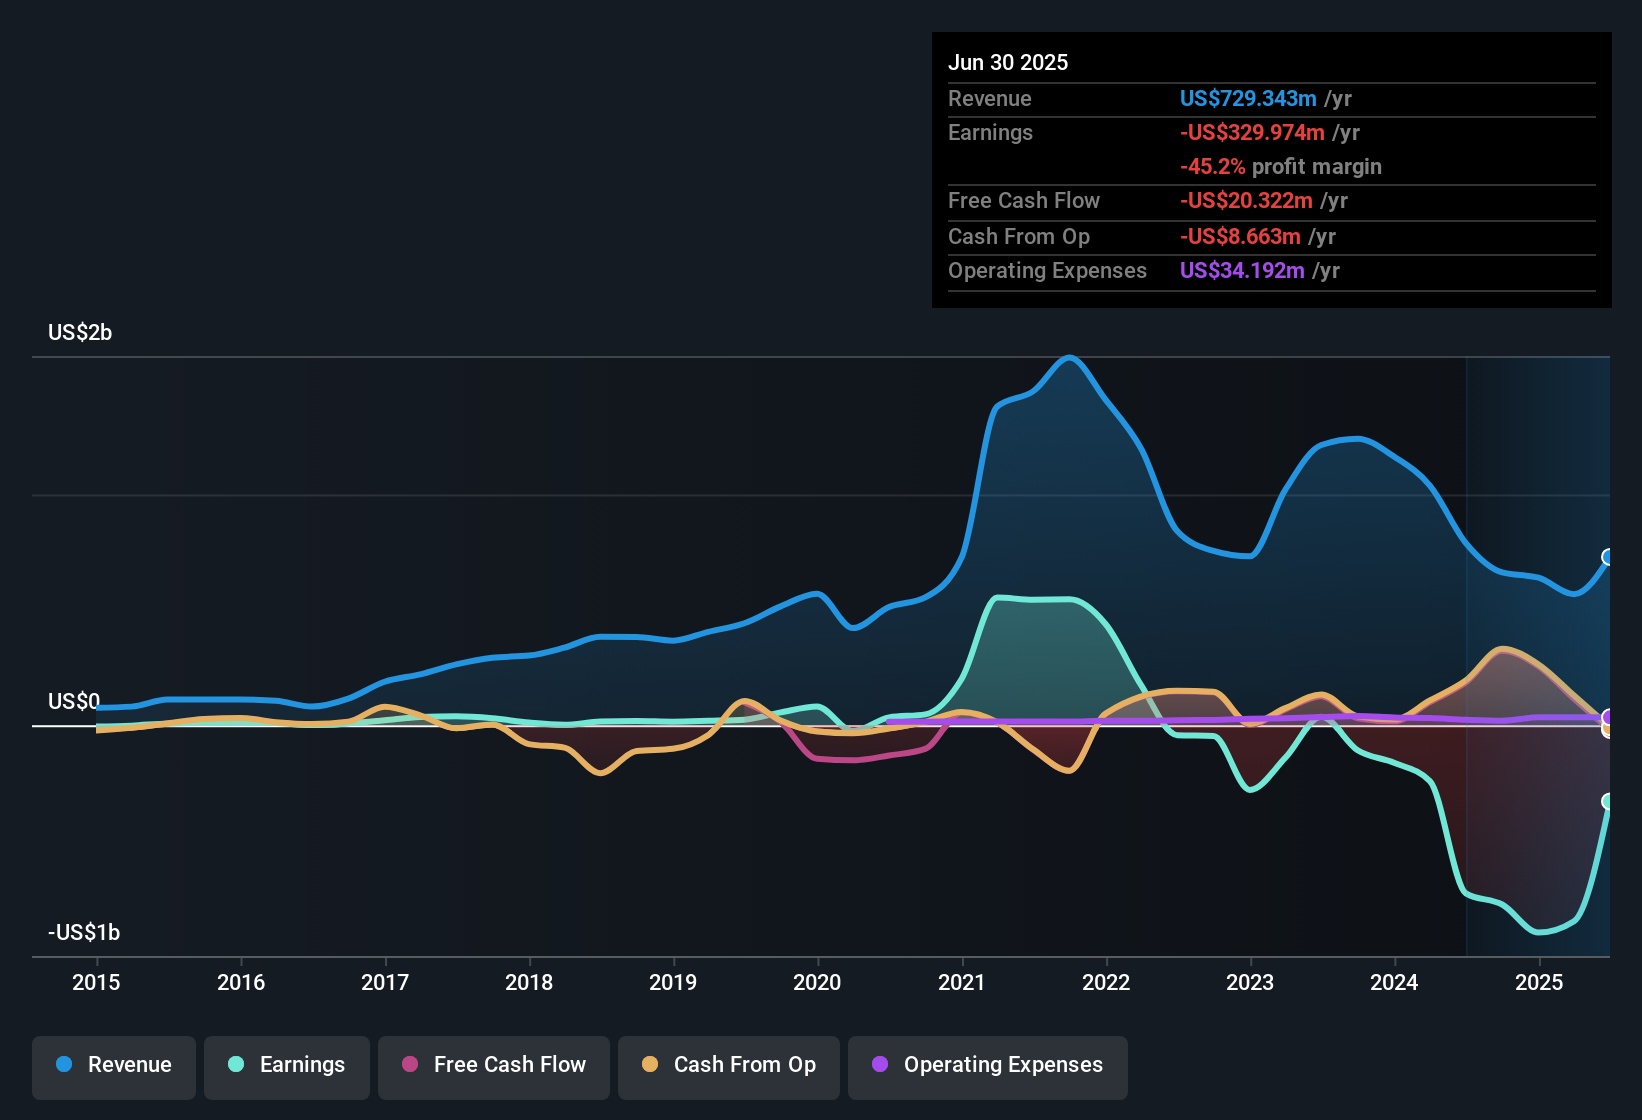
- Over the trailing 12 months, net income excluding extra items totals a loss of about $330.0 million, so the latest profit sits against a backdrop of sustained red ink.
- With trailing basic EPS at around negative $10.82 versus positive $2.23 in Q2 alone, the bearish focus on deteriorating multi year performance still aligns more closely with the longer term data than with a single strong quarter.
Trailing losses contrast with Q2 rebound
- Even after Q2’s improvement, trailing 12 month basic EPS is about negative $10.82 on roughly $729.3 million of revenue, compared with a single quarter where EPS turned positive and revenue reached about $199.4 million.
- Critics argue that profitability has deteriorated over the years, and the trailing figures continue to back a bearish narrative despite the recent uptick.
- Losses have reportedly worsened at an average rate of about 67.7 percent per year over the past five years, and the latest trailing net loss of roughly $330.0 million is consistent with that picture.
- While Q2 shows a turnaround at the quarterly level, the trailing revenue line is lower than the $1.0 billion reported in early 2024, so bears still see a company that has not yet demonstrated a sustained recovery in its top line.
Deep value signals with high risk
- At a share price of $5.72, RILY trades on a price to sales ratio of about 0.2 times and against a DCF fair value estimate of roughly $154.14, implying the stock sits around 96 percent below that DCF fair value.
- Supporters point to these valuation gaps as a bullish setup, but the same data also underlines why many still view the stock as high risk.
- The price to sales multiple is well below both the 16.6 times peer average and the 3.8 times US Capital Markets industry average. This heavily supports the idea that the market is pricing in significant challenges.
- At the same time, negative shareholders’ equity and recent share price volatility mean that any bullish case built on the discount to DCF fair value is working against a balance sheet that still reflects years of cumulative losses.
Next Steps
Don't just look at this quarter; the real story is in the long-term trend. We've done an in-depth analysis on B. Riley Financial's growth and its valuation to see if today's price is a bargain. Add the company to your watchlist or portfolio now so you don't miss the next big move.
See What Else Is Out There
B. Riley’s sharp Q2 rebound still sits on years of deep losses, negative equity, and volatile earnings that leave its financial foundations looking fragile.
If that kind of balance sheet risk makes you uneasy, consider shifting your attention to companies in our solid balance sheet and fundamentals stocks screener (1943 results) and focus on businesses built on stronger, more resilient finances.
This article by Simply Wall St is general in nature. We provide commentary based on historical data and analyst forecasts only using an unbiased methodology and our articles are not intended to be financial advice. It does not constitute a recommendation to buy or sell any stock, and does not take account of your objectives, or your financial situation. We aim to bring you long-term focused analysis driven by fundamental data. Note that our analysis may not factor in the latest price-sensitive company announcements or qualitative material. Simply Wall St has no position in any stocks mentioned.
Have feedback on this article? Concerned about the content? Get in touch with us directly. Alternatively, email editorial-team@simplywallst.com